Blog
A running log of how spatial thinking gets applied to real questions — cities, satellites, networks, and the decisions they inform. Some pieces are tutorials, some are arguments; all of them come from work actually done.
3D City Dioramas in Python
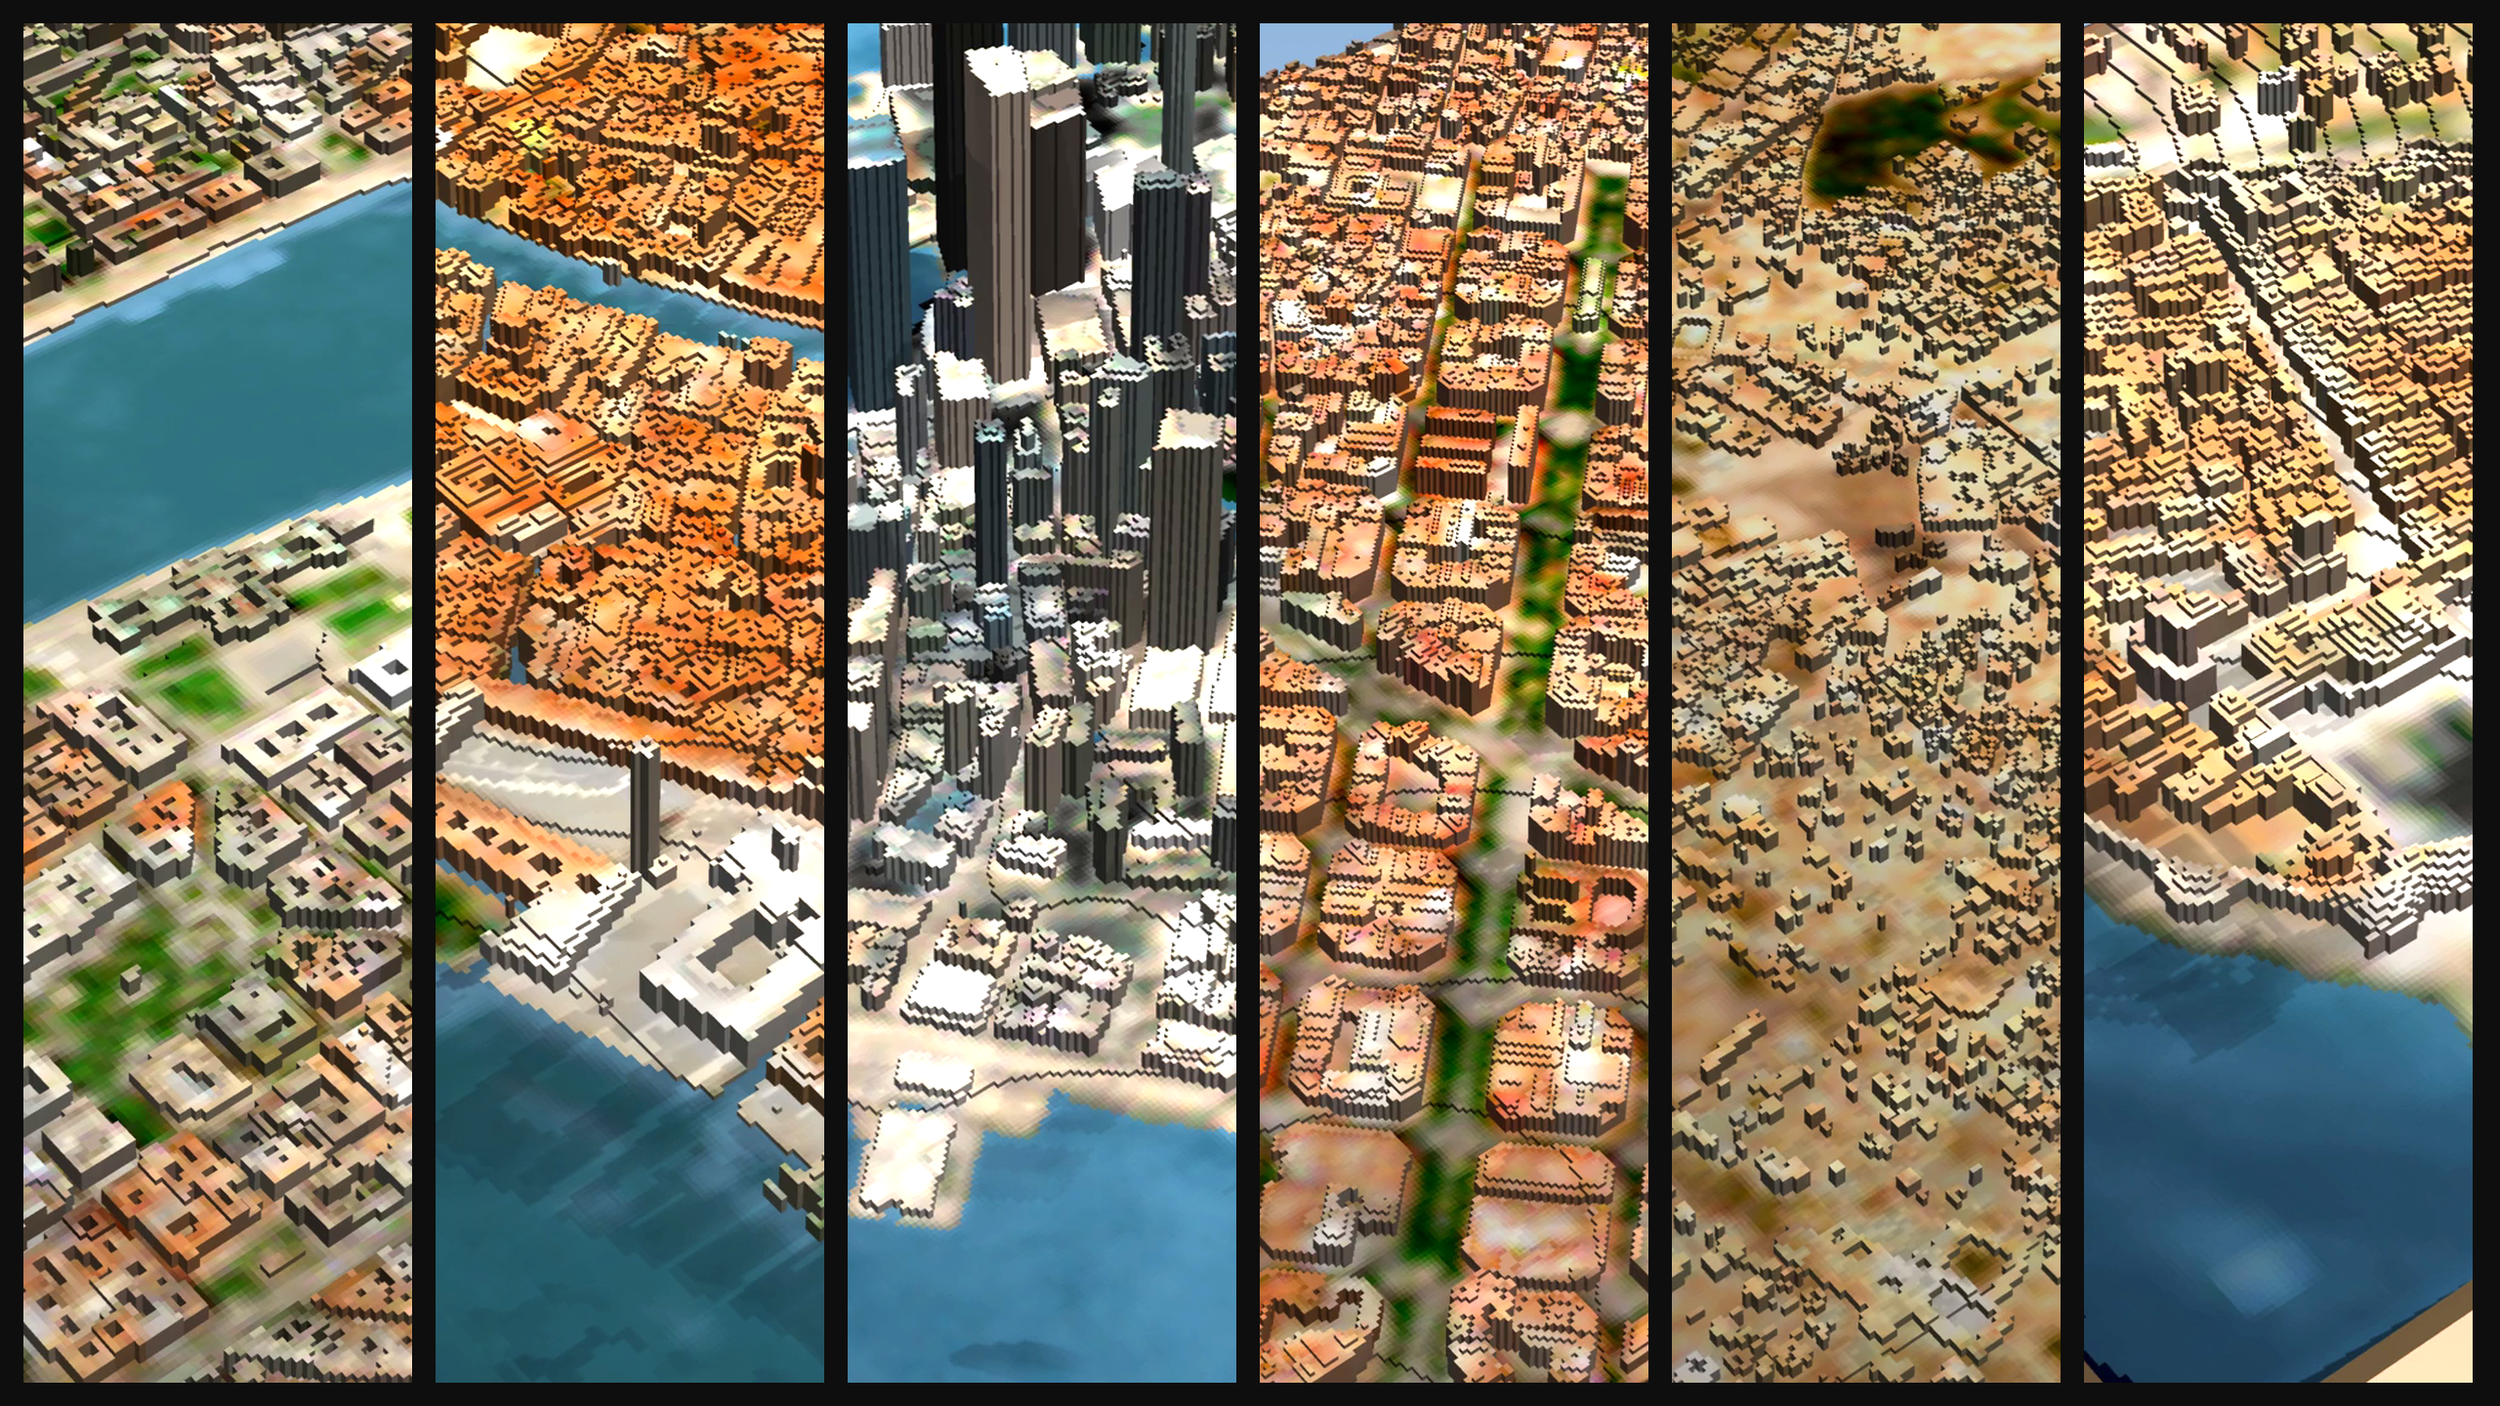
A voxel diorama of a real place is three layers stacked on each other. OpenStreetMap says where the buildings are, the Copernicus DEM says what the ground underneath them does, and Sentinel-2 says what the whole thing looks like. None of it costs anything and none of it needs an API key. Here is what each layer contributes, where each one stops, and what you can do with the model once it is built.
Where Nobel laureates were born — an interactive map
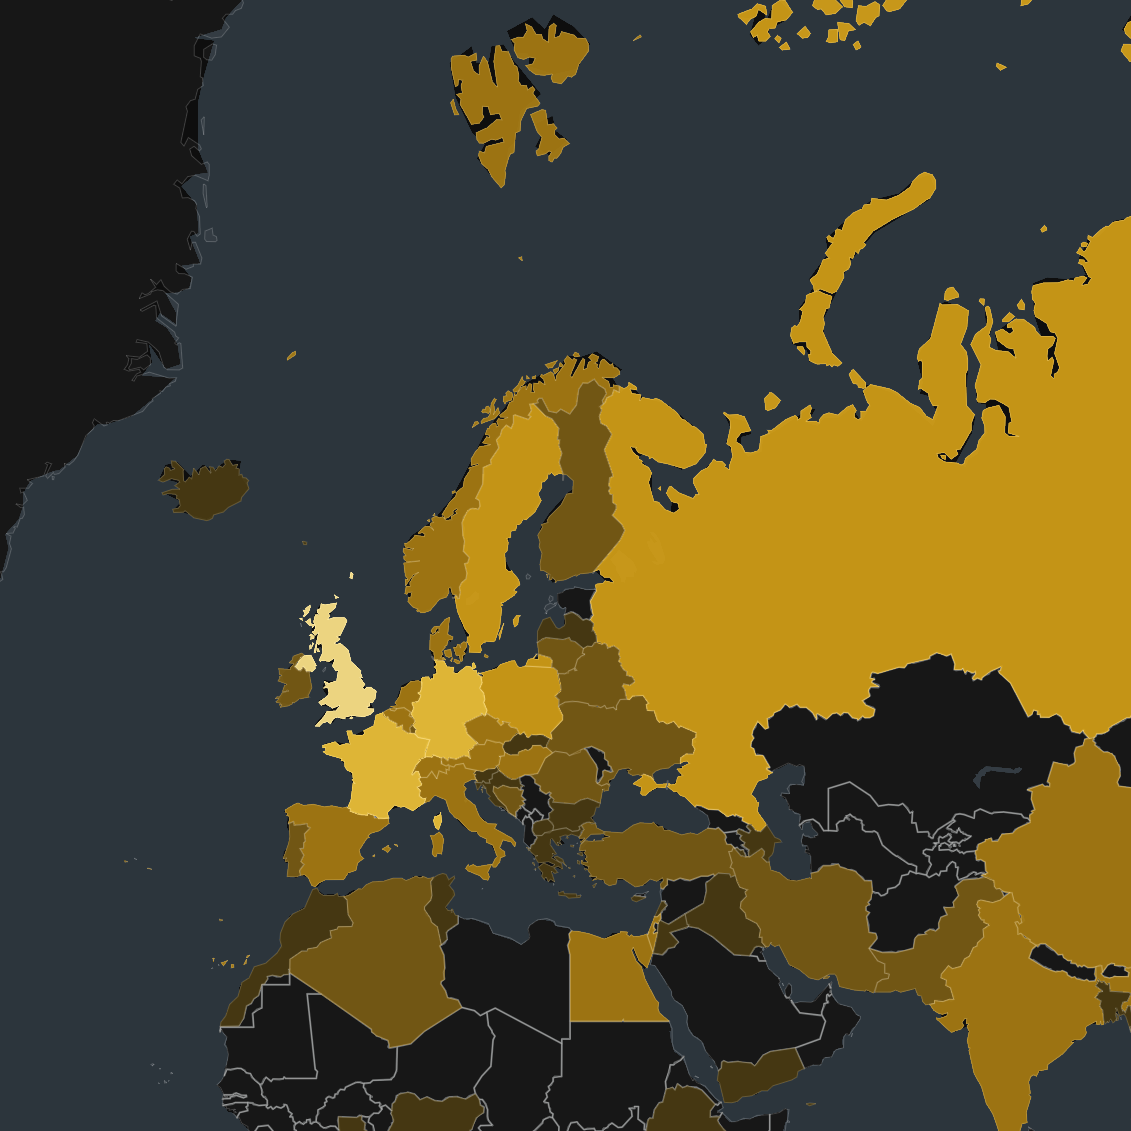
Every October the same ritual: the Nobel prizes are announced, and the same handful of countries take a bow. I wanted the full picture instead — every prize since 1901, every laureate placed where they were actually born. So I built it: an interactive map with a time slider, filters for the six prize categories, and two normalisations that quietly rewrite the leaderboard. By raw count, the United States dominates with 298 laureates. Per ten million people, it falls to fifteenth — and Sweden takes the crown.
GeoAI - From a raster you draw by hand to a model you trained
There is a version of GeoAI that starts by downloading a pretrained model and running it — and leaves you unable to say why the map is wrong when it is wrong. This journey takes the other route: six steps from getting your hands on satellite data to a U-Net you assembled from a single convolution filter, on real Sentinel-2, aerial, and LiDAR data, and only then the models you borrow. GeoAI from scratch, on a laptop.
Urban data science with Python
Cities are the most interconnected systems most of us will ever work with, and almost all of their data is open. This journey teaches you to acquire a city from OpenStreetMap, turn it into a reusable urban profile, and then model it — accessibility, site selection, livability, and price — at the resolution of individual buildings, before closing with the network analytics that run underneath all of it. Six steps, mostly vector data, one city at a time.
How to get started in geospatial data science
Most people meet geospatial the hard way, jumping right into the middle — a client request, a new library, an error message nobody can explain. This journey goes the other way: seven steps from an empty computer to geospatial-ready Python, built for people leaving point-and-click GIS and for data scientists who just realised their problems were spatial all along. Four of the seven steps are not about maps, and that is not a coincidence.
The New Science of Maps
Ever since I started sharing geospatial work, the most common question has been where do I start? Now there is a proper answer: three ordered routes through the whole library — Getting Started, Urban Data Science, and GeoAI — each a sequence of courses, books, and free tutorials where every step assumes the one before it. Here is how they fit together, and which one is yours.
Five ways I actually use AI as a geospatial data scientist
I've written over 13,000 prompts for geospatial Python work, and one in four was me correcting the model. Here are the five ways I actually use AI, from a 3D Manhattan built in one prompt to mining 1,281 of my own conversations, and why each one still needs a driver who knows the territory.
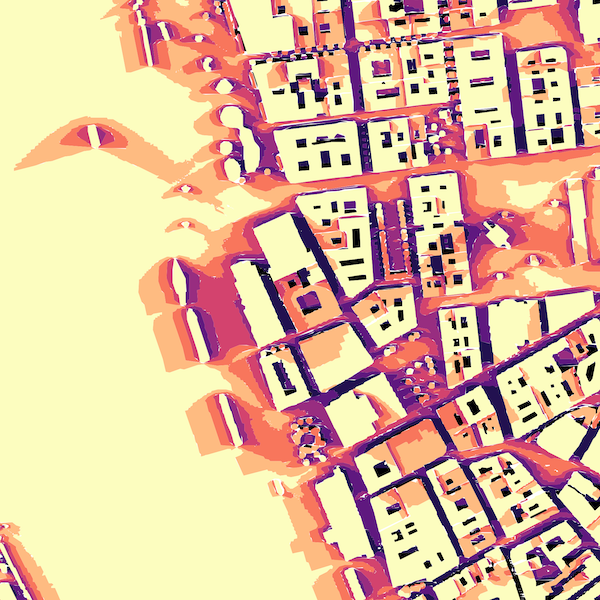
Shade is climate infrastructure — so I built a tool that maps it in seconds
A while ago, shademap.app went viral: pick any place on Earth, drag a time slider, watch the shadows of every building crawl across the streets. What struck me was not just the idea — it was the speed. Every shadow tool I had met before, mostly inside desktop GIS stacks, was painfully slow: computing a single neighbourhood could take hours. And here was a website doing it in real time, in a browser.
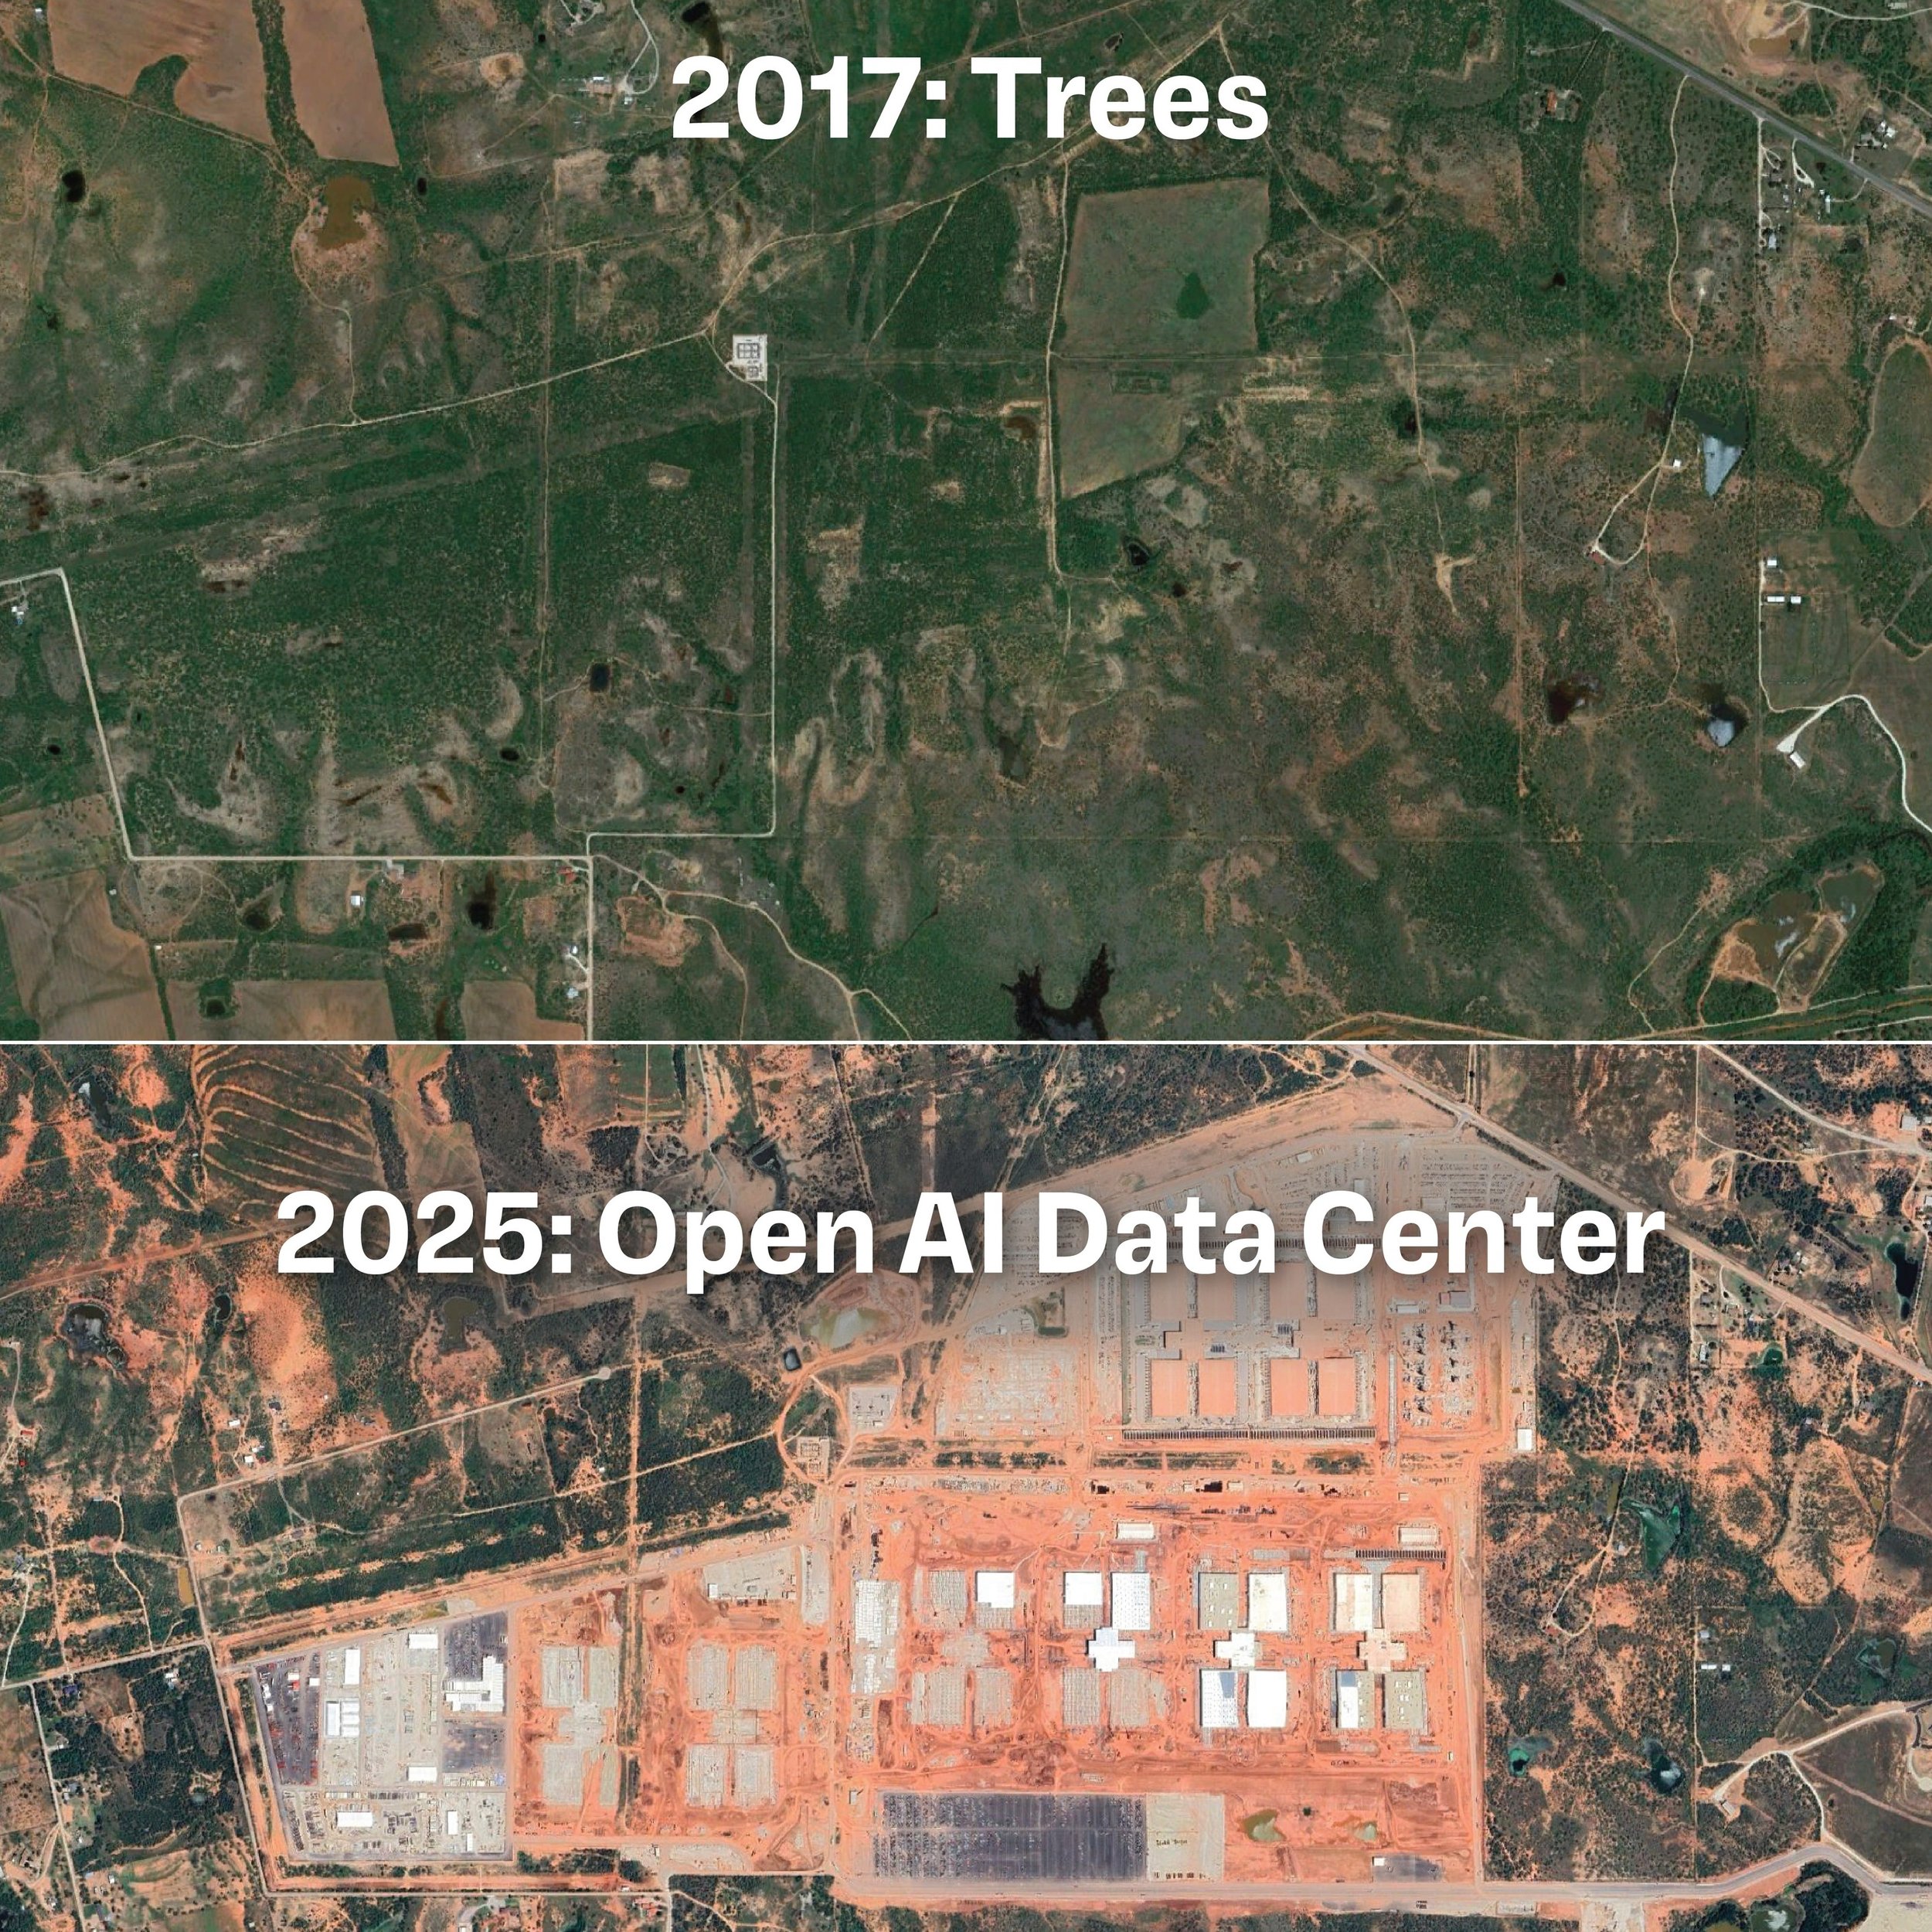
Two data-center questions, answered with satellites and open data
The AI build-out has made data centers a lightning rod — for their energy appetite, their water use, and, this summer, a viral wave of before-and-after images claiming they're bulldozing forests. I ran the numbers on two of the biggest open questions, both with free, public geospatial data. Here's what the evidence actually says.
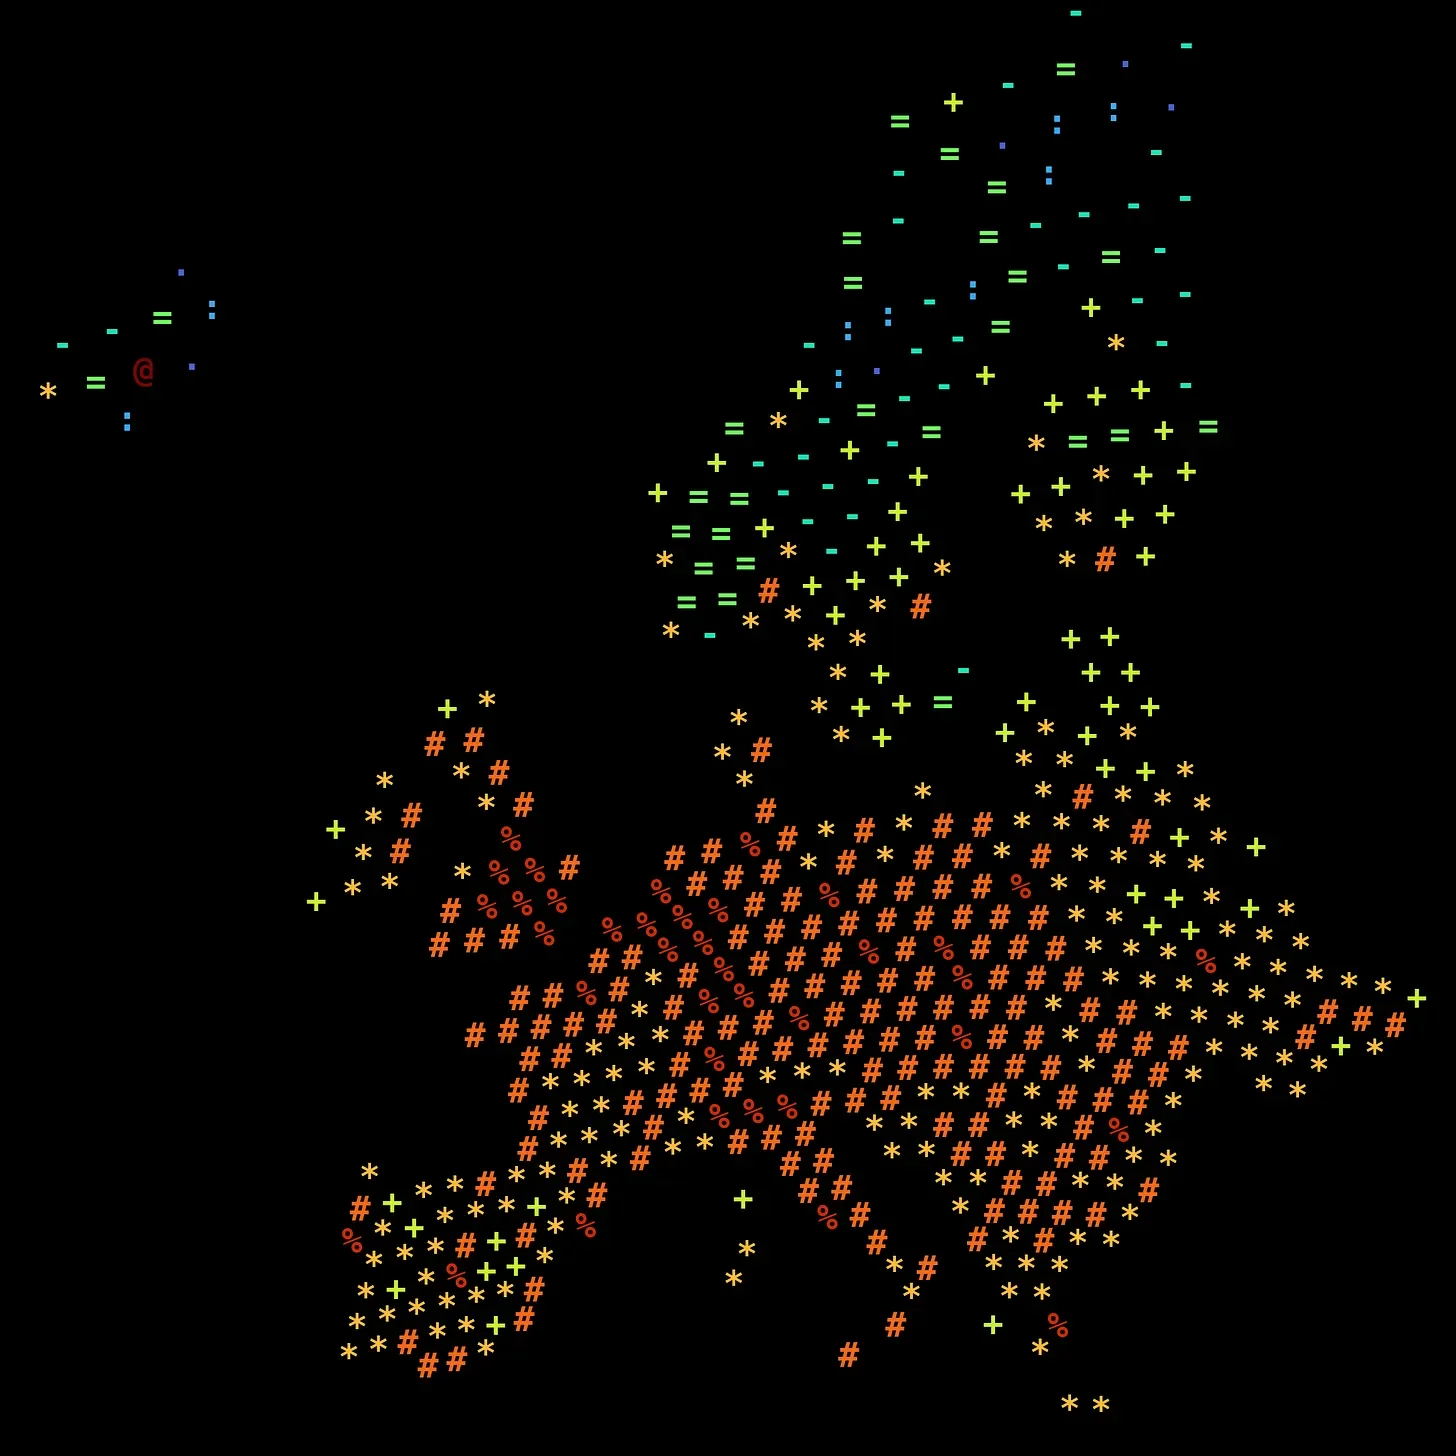
The Map of Geospatial Data Science: How to Actually Learn It
I spent years doing data science on problems that were quietly about place — without knowing GIS existed. This is the map I wish I'd had: what the field is, its sub-areas, the core Python stack, and the order to learn it in.
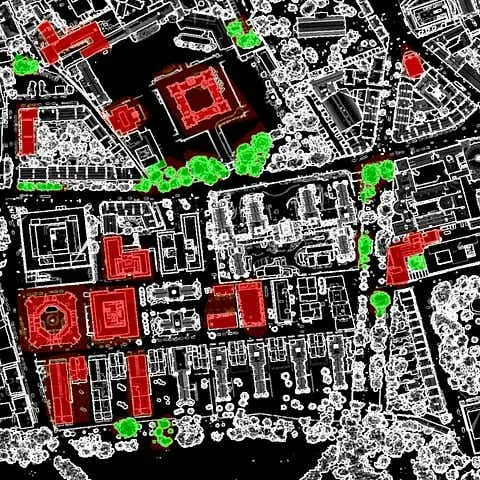
What Is GeoAI — and Why Does It Matter?
By now, humanity has wrapped the planet in sensors, from the smartphones in our pockets to the satellites circling the globe, generating spatial data at a previously unimaginable scale — and the capacity to make sense of it all is still catching up. GeoAI is here to help to close that gap
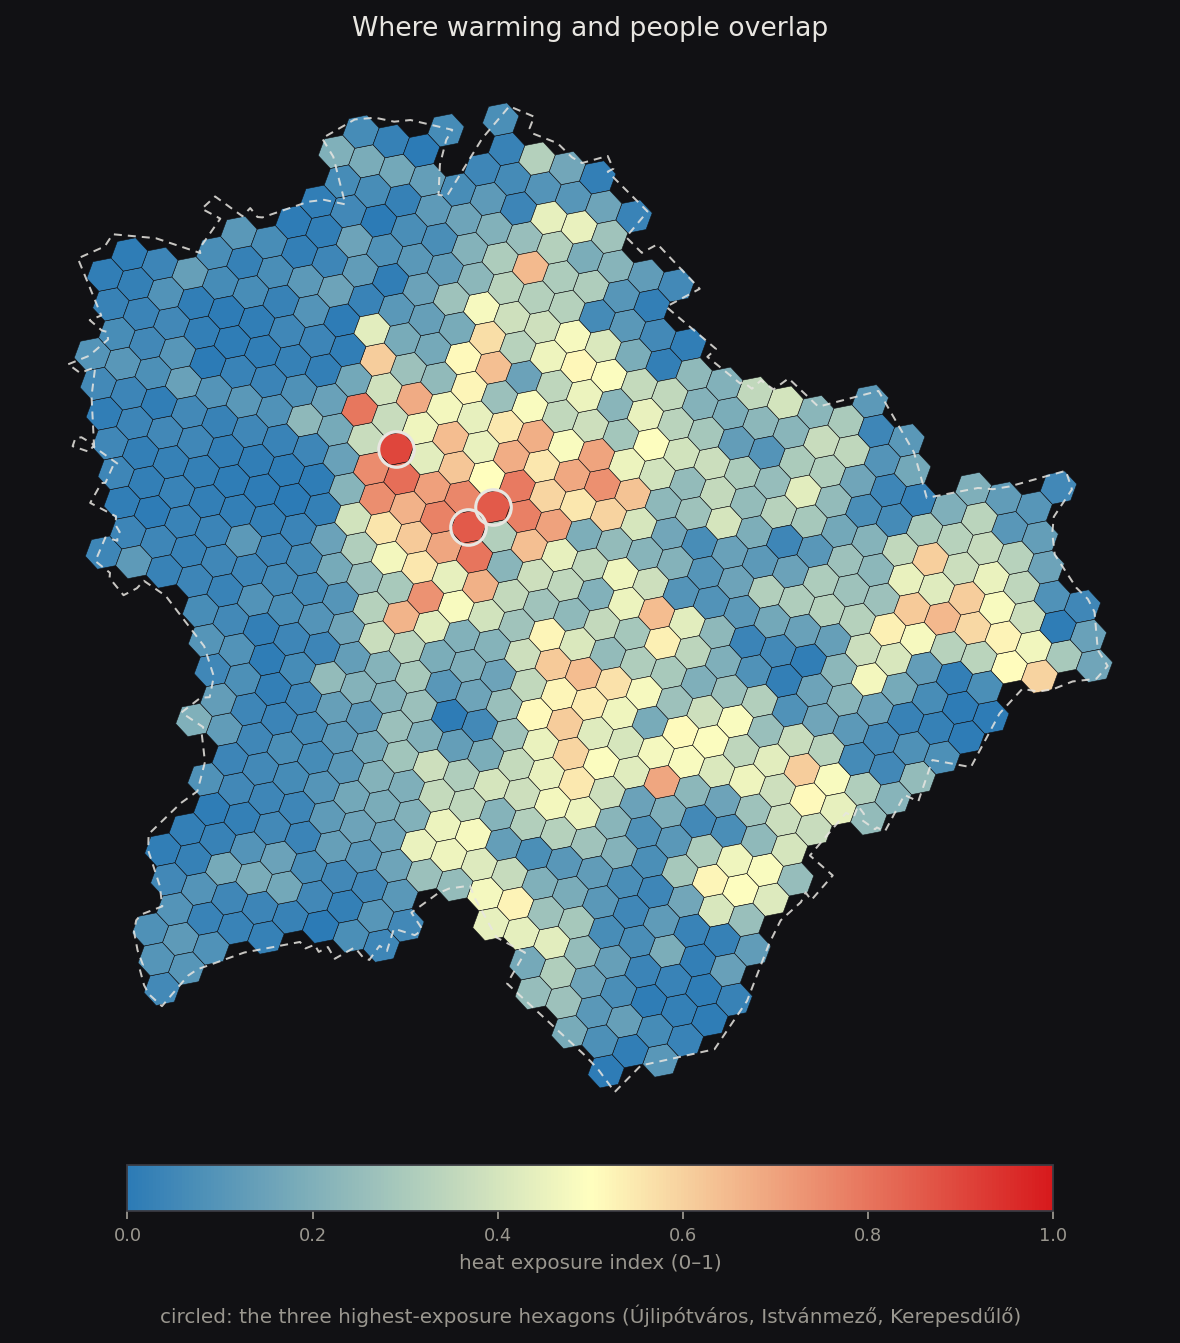
Where the Heat Meets the People
The heat map turned out to be the easy half. Budapest's fastest-warming corners are nearly empty — twelve residents in one of them — while the crowds live where the map barely glows. Cross twenty years of satellite warming with a population grid, and a different city appears: one where heat and people overlap in just 43 hexagons.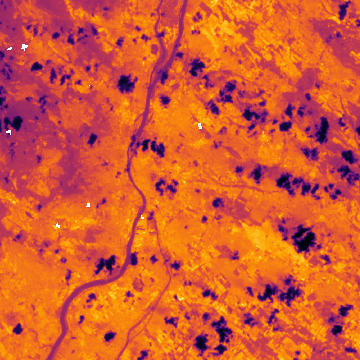
Forty Summers of Heat
Every August, the same conversation happens in Budapest: it never used to be this hot. Satellites have been quietly recording an answer since 1984 — and the whole archive is free. Here is what four decades of thermal imagery show about Hungary's hottest surfaces, and why the heat island number everyone quotes hides most of the warming.