Two data-center questions, answered with satellites and open data
The AI build-out has made data centers a lightning rod — for their energy appetite, their water use, and, this summer, a viral wave of before-and-after images claiming they're bulldozing forests. I ran the numbers on two of the biggest open questions, both with free, public geospatial data. Here's what the evidence actually says.
The satellite view of a construction of a hyper-scale data center.
1. Are data centers destroying forests? (Mostly no — they're paving farmland)
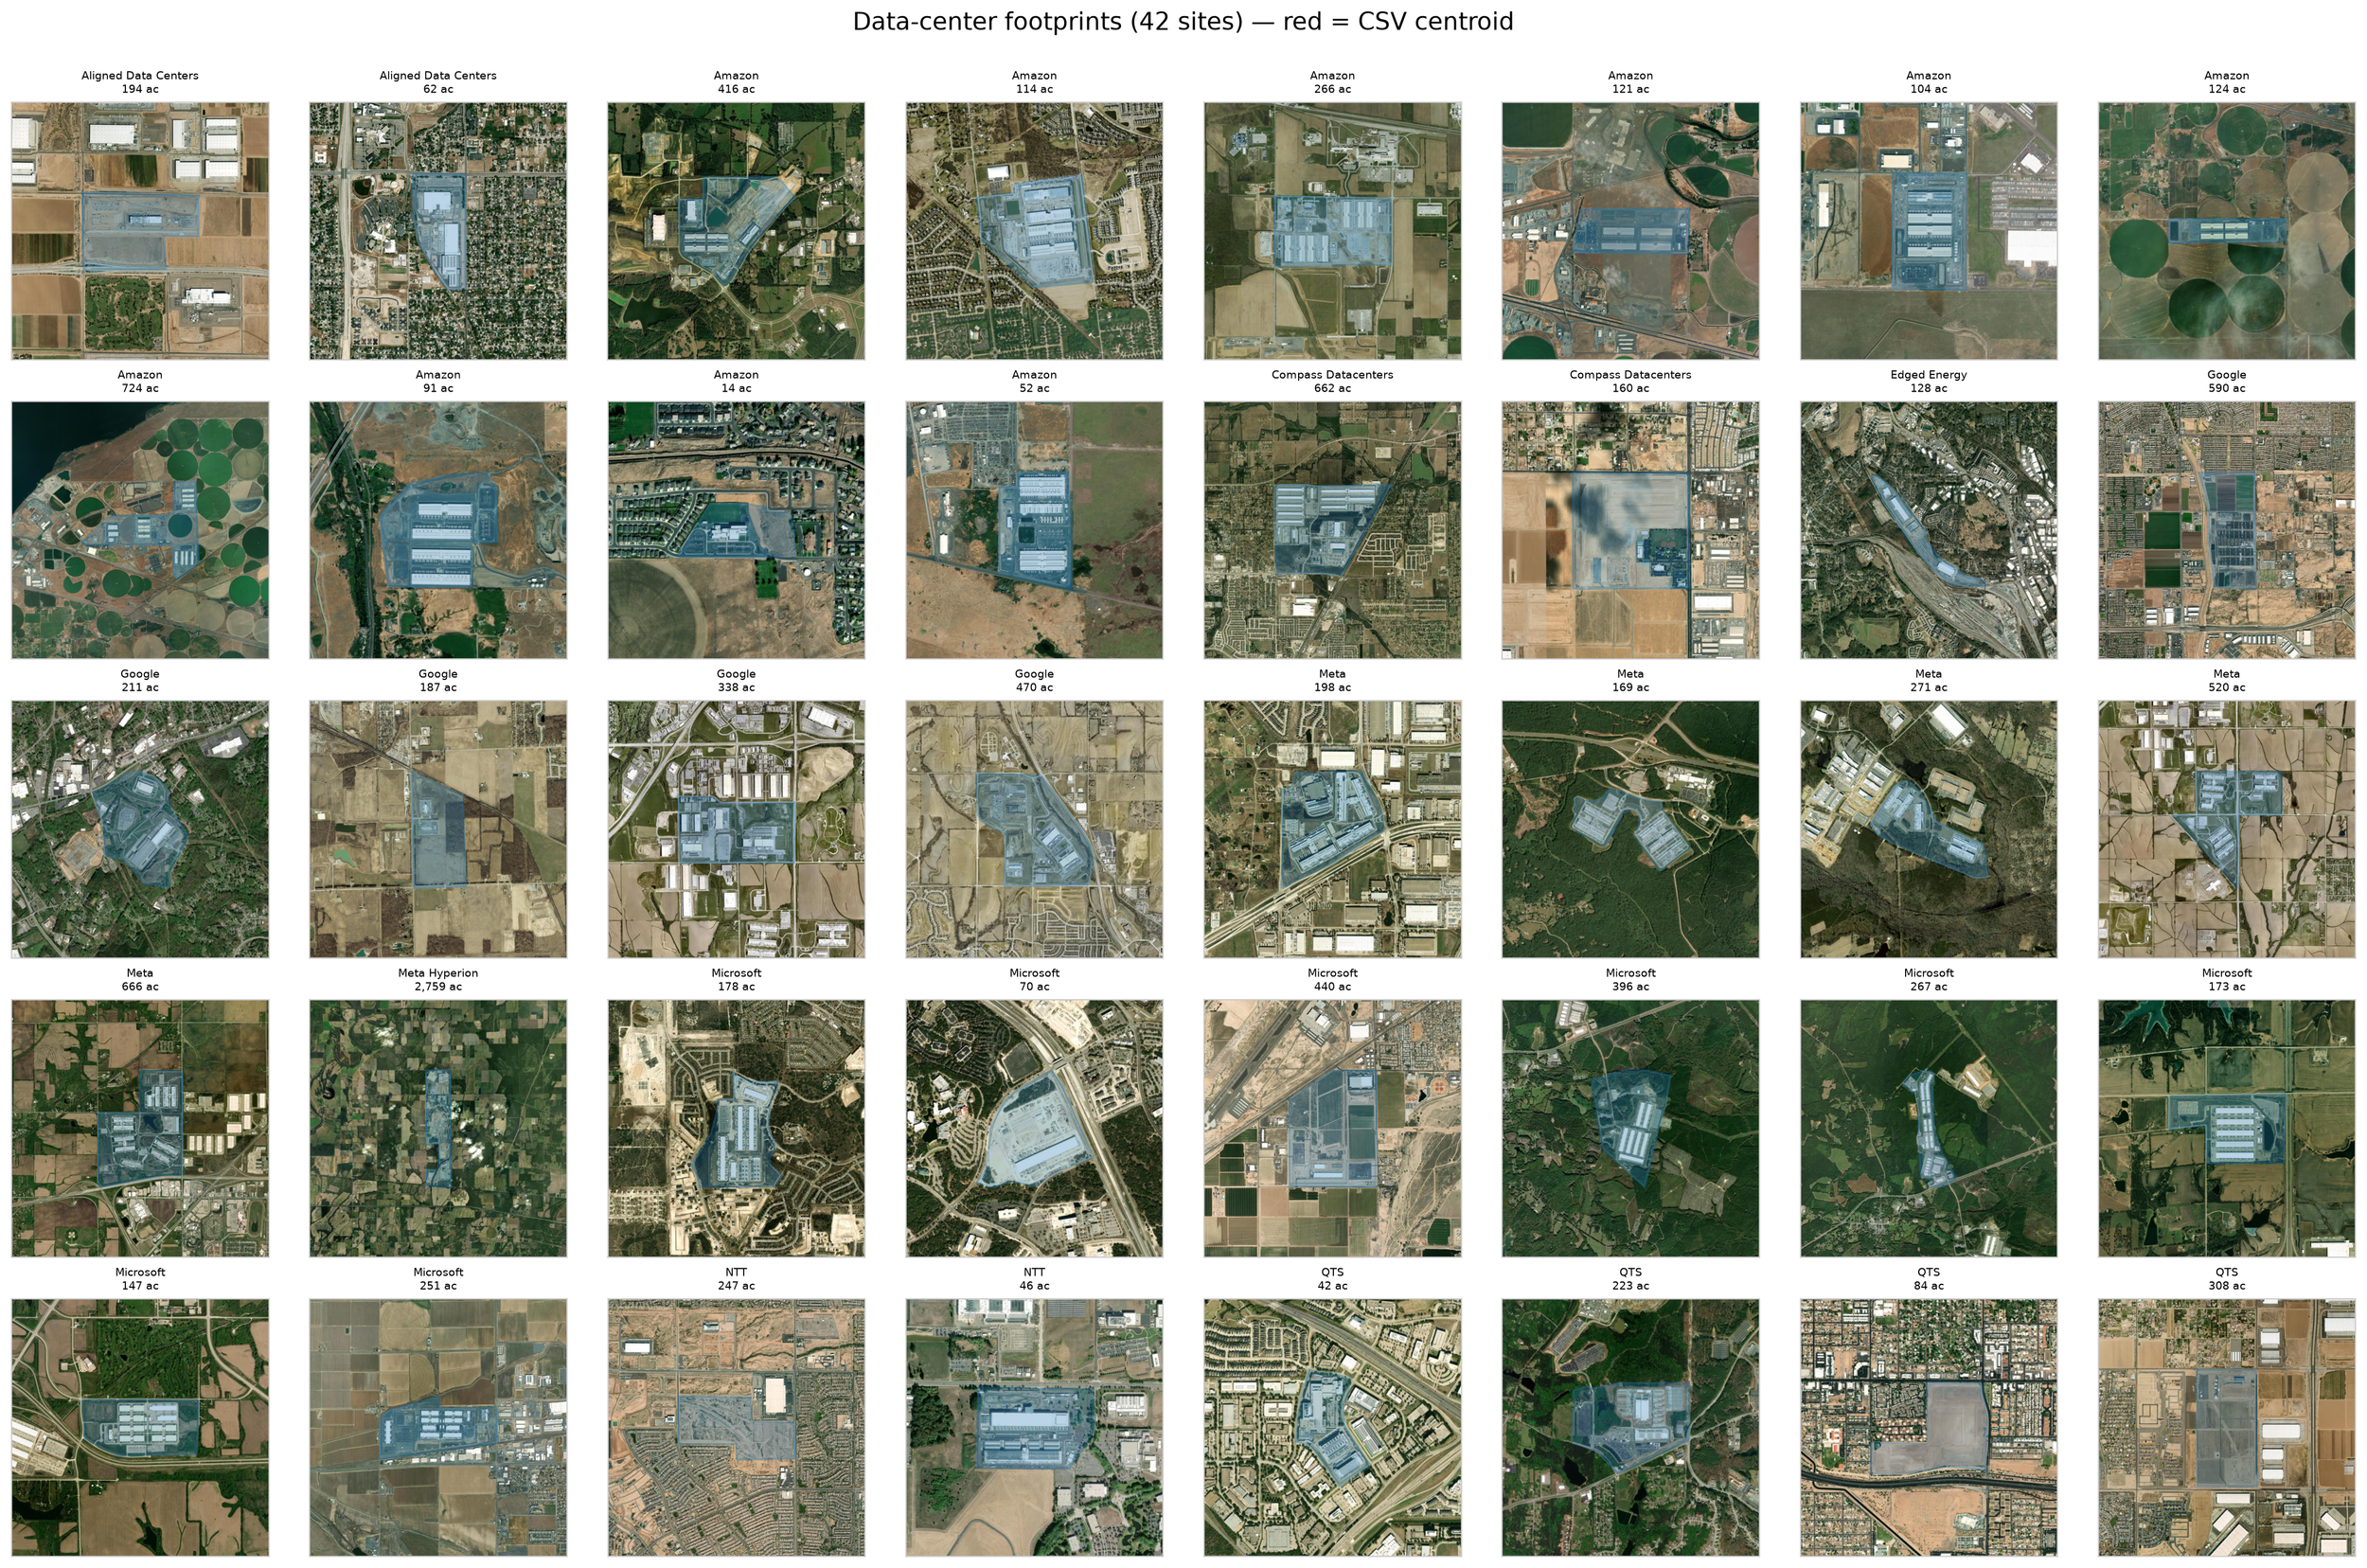
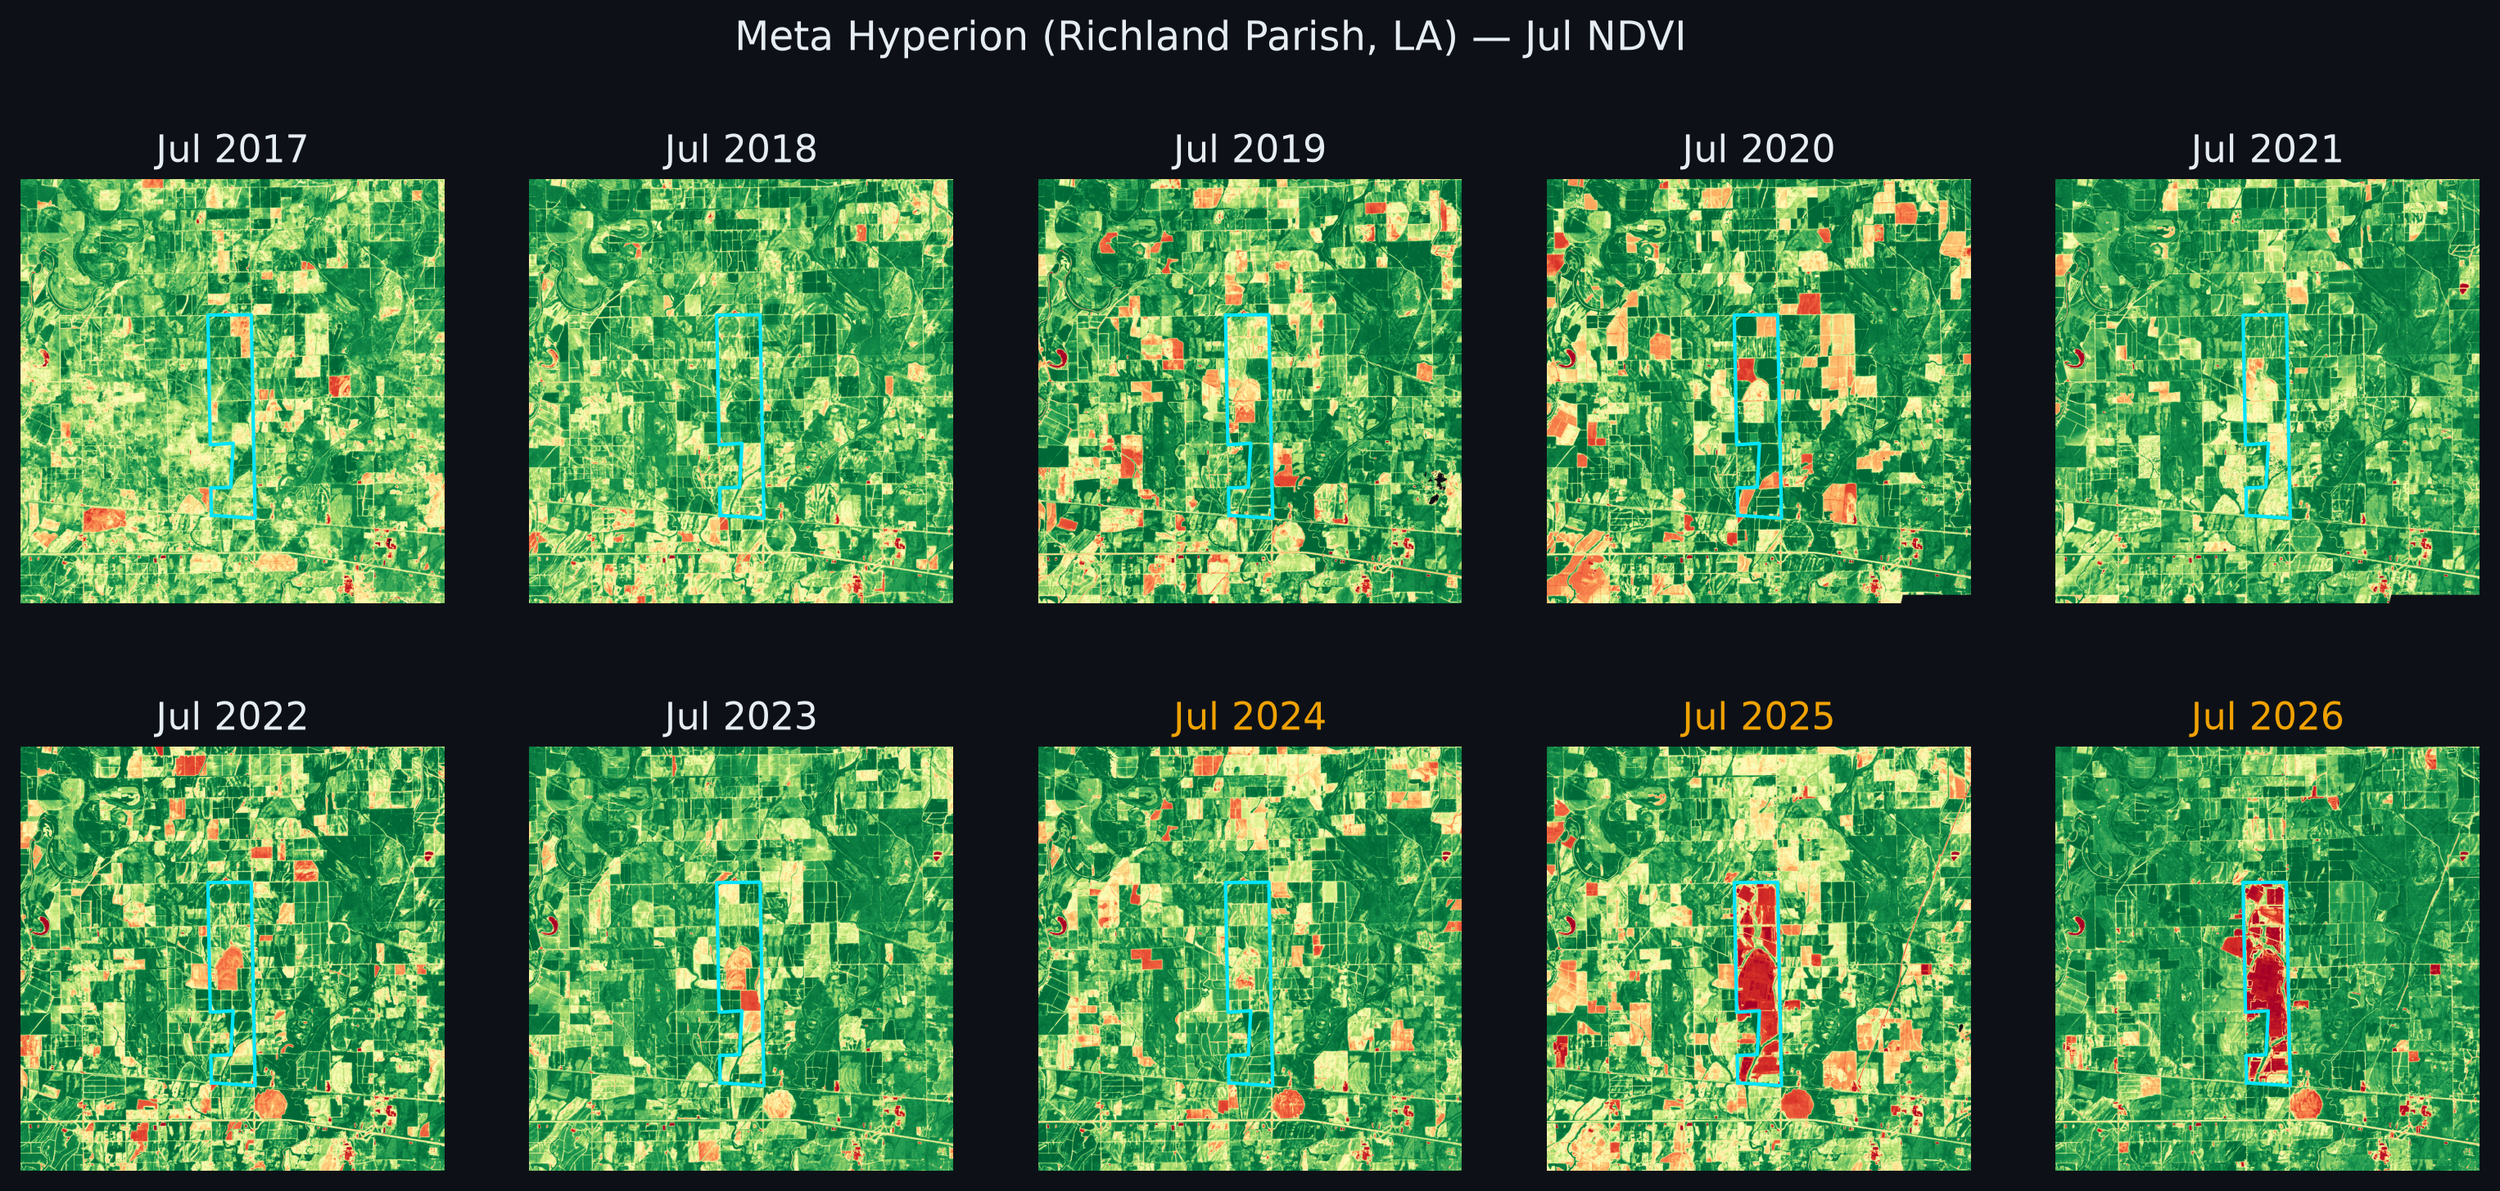
A set of paired satellite images went viral in summer 2026, appearing to show hyperscale data centers built over cleared forest, and the reaction split hard between alarm and pushback. So I measured it properly: using Sentinel-2 imagery across the 42 largest U.S. data centers, with phenology-matched peak-greenness NDVI composites to kill the seasonal bias that makes naive before/after comparisons misleading, and each site differenced against its own surroundings to strip out weather and crop cycles.
The result reframes the viral claim rather than confirming it. Of roughly 51 km² of combined footprints, about 60% was cropland and 26% already-developed land — forest was only about 6%. Nineteen sites show a clear construction break (2020–2025, peaking in 2023), and forest conversion is real and produces the sharpest losses where it happens — but among the largest facilities it's the exception, not the rule. The honest headline isn't "deforestation," it's siting: these things go up mostly on farmland and already-cleared ground.
👉 Read the full analysis: https://open.substack.com/pub/milanjanosov/p/quantifying-vegetation-loss-around
2. How much more can the U.S. even build? (Tens of gigawatts, not hundreds)
The other question is the ceiling: setting demand aside, how much of the country is physically capable of hosting new hyperscale capacity, given power, climate, water, terrain, and protected-land constraints? I built a national feasibility framework on Uber's H3 hexagonal grid, calibrated purely on where hyperscale facilities have actually been built — no demand forecasts, no optimization assumptions — using two independent unsupervised models (a similarity envelope and a kernel-density surface), both gated so good environment can never compensate for missing power infrastructure.
They converge tightly: existing hyperscale load sits around 4.5–5 GW today, and total physically feasible capacity lands in the range of roughly 25–50 GW at the low-to-mid end. In other words, the feasible envelope is far smaller than naive land-availability suggests — pushing much beyond 100 GW would require transforming the grid, the regulatory environment, or siting practices themselves.
👉 Read the full feasibility study: https://open.substack.com/pub/milanjanosov/p/how-much-of-the-united-states-can-369
Taken together, the two paint a sharper picture than the discourse: the land footprint is real but concentrated on farmland and prior development rather than forest, and the room to keep expanding is physically bounded in the tens of gigawatts. Both are built entirely on free, open data and fully reproducible — the full write-ups, methods, and code are on Substack.