Shade is climate infrastructure — so I built a tool that maps it in seconds
A while ago, shademap.app went viral: pick any place on Earth, drag a time slider, watch the shadows of every building crawl across the streets. What struck me was not just the idea — it was the speed. Every shadow tool I had met before, mostly inside desktop GIS stacks, was painfully slow: computing a single neighbourhood could take hours. And here was a website doing it in real time, in a browser.
The second thing came from my urban climate work. The more heat mapping I do, the more shade turns out to be the adaptation that actually matters on the street: it is one of the few interventions a pedestrian feels immediately, and it is the one cities are actively investing in — especially through new tree planting. But to plan where trees should go, you first need to know where shade already falls, and where it is missing at four in the afternoon in July.
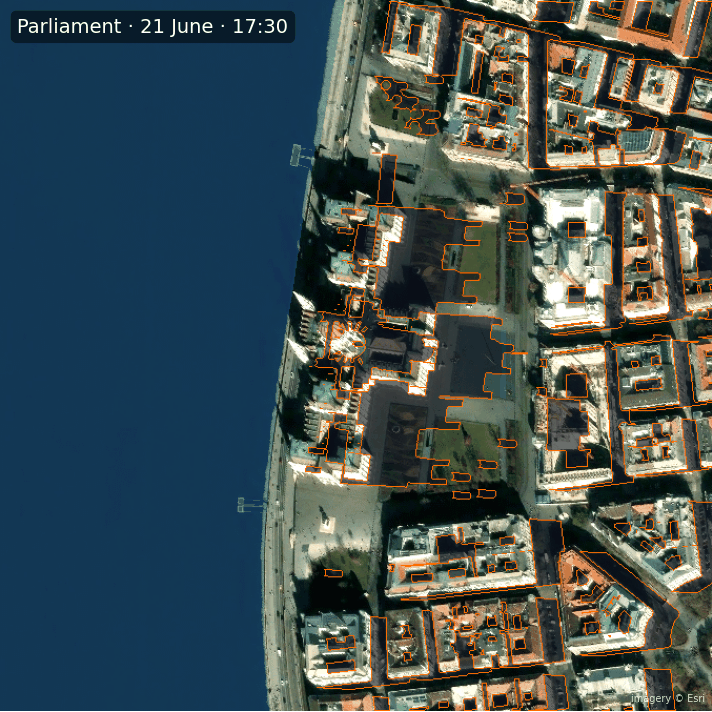
So I built cityshade, an open-source Python library that answers exactly that. The new video walks through the whole thing: a central Budapest district shaded in about 15 milliseconds per frame, every building of the city (258,495 of them) in 0.7 seconds on a plain laptop CPU, and, as the closing piece, the Hungarian Parliament turned into a sundial — its shadow every fifteen minutes from sunrise to sunset, drawn over satellite imagery.
The trick is not new hardware and not a GPU. It is a 25-year-old algorithm that almost nobody outside the research literature seems to use, and it has one property that changes everything: the cost depends on pixels, not on buildings. I tested this directly — same area, ten times fewer buildings, same speed; twice the buildings, same speed. Once cost follows area instead of object count, a whole capital is just a bigger picture.
One honesty note, because everything else hangs on it: this is geometry, not physics. The sun is a direction, buildings are their footprints pulled up to one height, trees are solid columns, and every day is cloudless. Those are real simplifications — and they are the same ones the viral app makes, and the reason both run fast anywhere on the planet. The mapped trees do cast shade in the model, which is exactly what you want when weighing where a new tree would matter most.
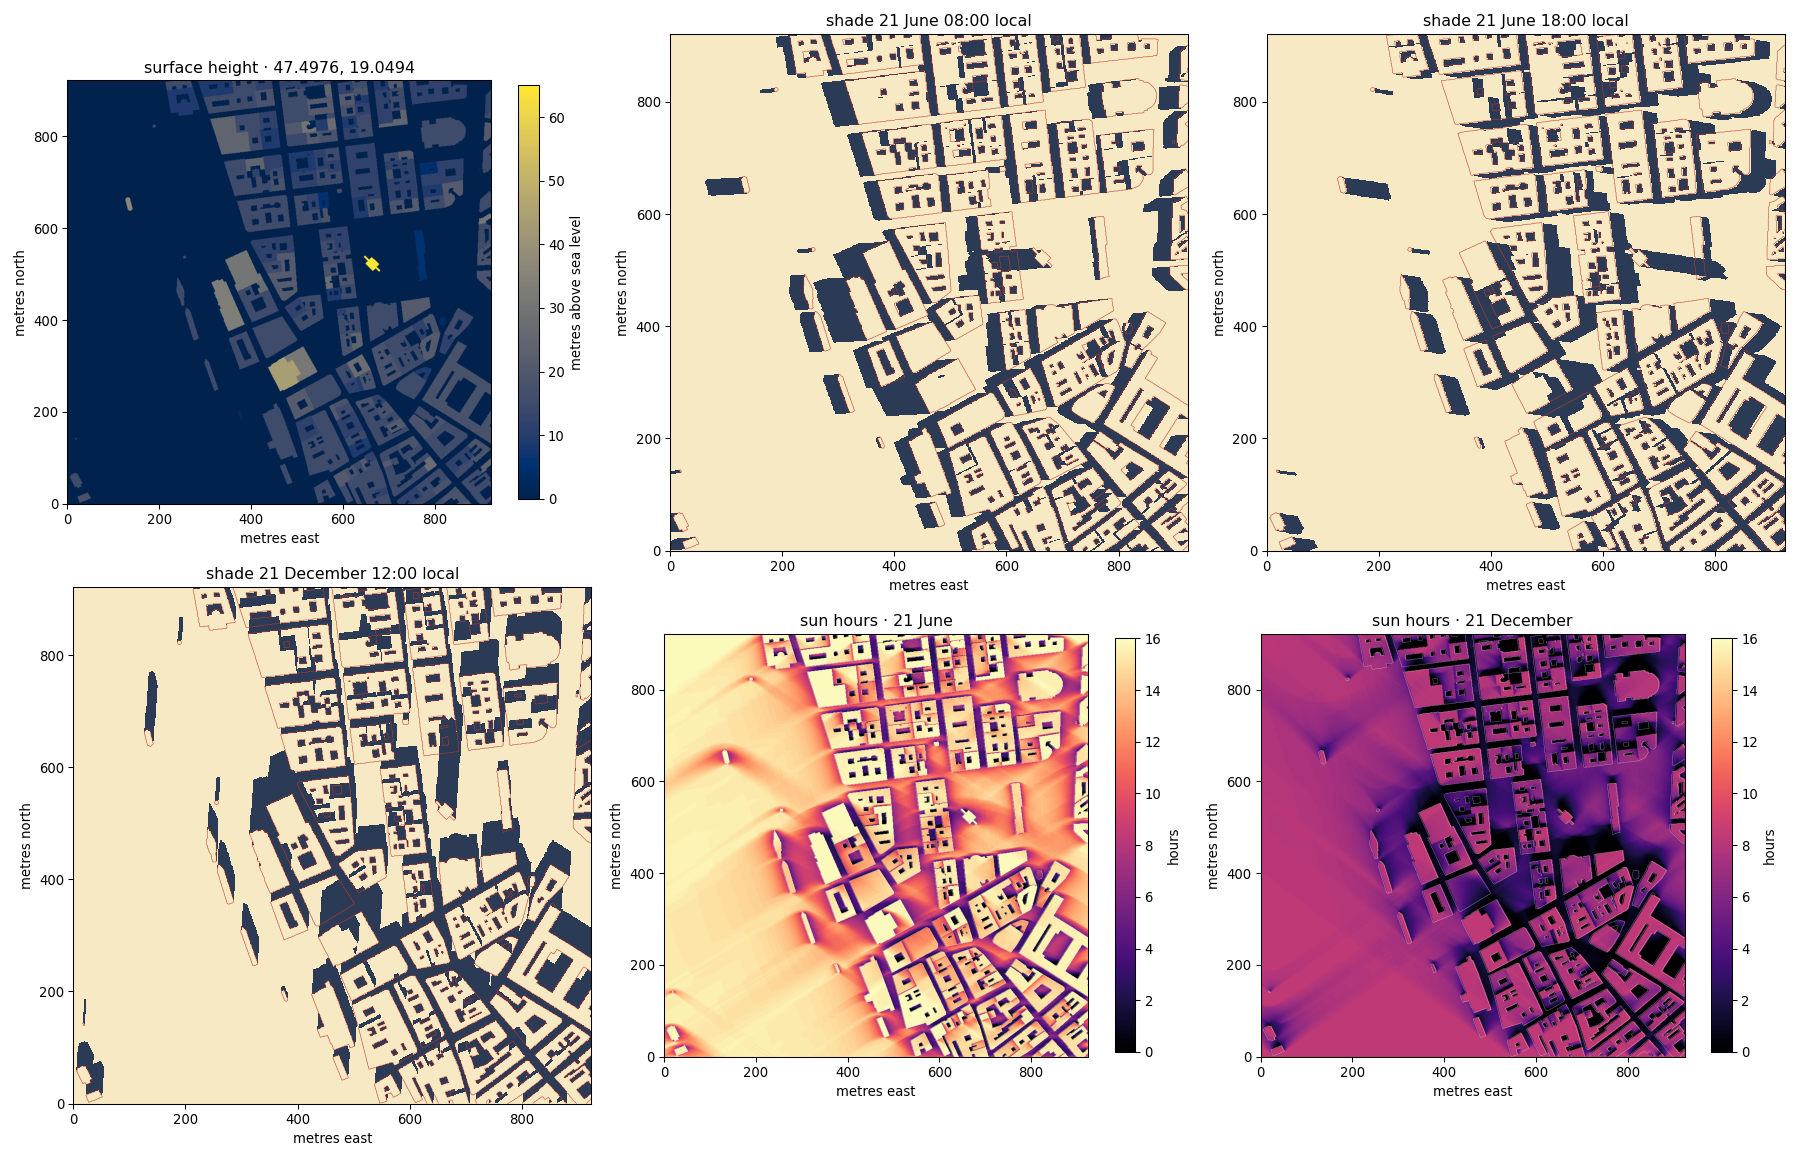
What it produces is the useful kind of map: where the shadows fall at any minute, how many hours of direct sun every square metre of pavement gets in June versus December, which side of the street stays dark all winter. And all of it exports to GeoPackage and GeoTIFF, so it drops straight into QGIS or any GIS workflow that expects vectors.
The full package — the library, the complete executed notebook from the video, the written guide, the tests, and the rendered examples including the Parliament sundial — is bundled here:
→ Get cityshade on Gumroad: https://janosovm.gumroad.com/l/cityshade
▶ Watch the full walkthrough:
Point it at your own coordinates and it fetches the buildings, the trees and the terrain itself. If you render your own city's sundial, send it to me — I genuinely want to see it.
