3D City Dioramas in Python
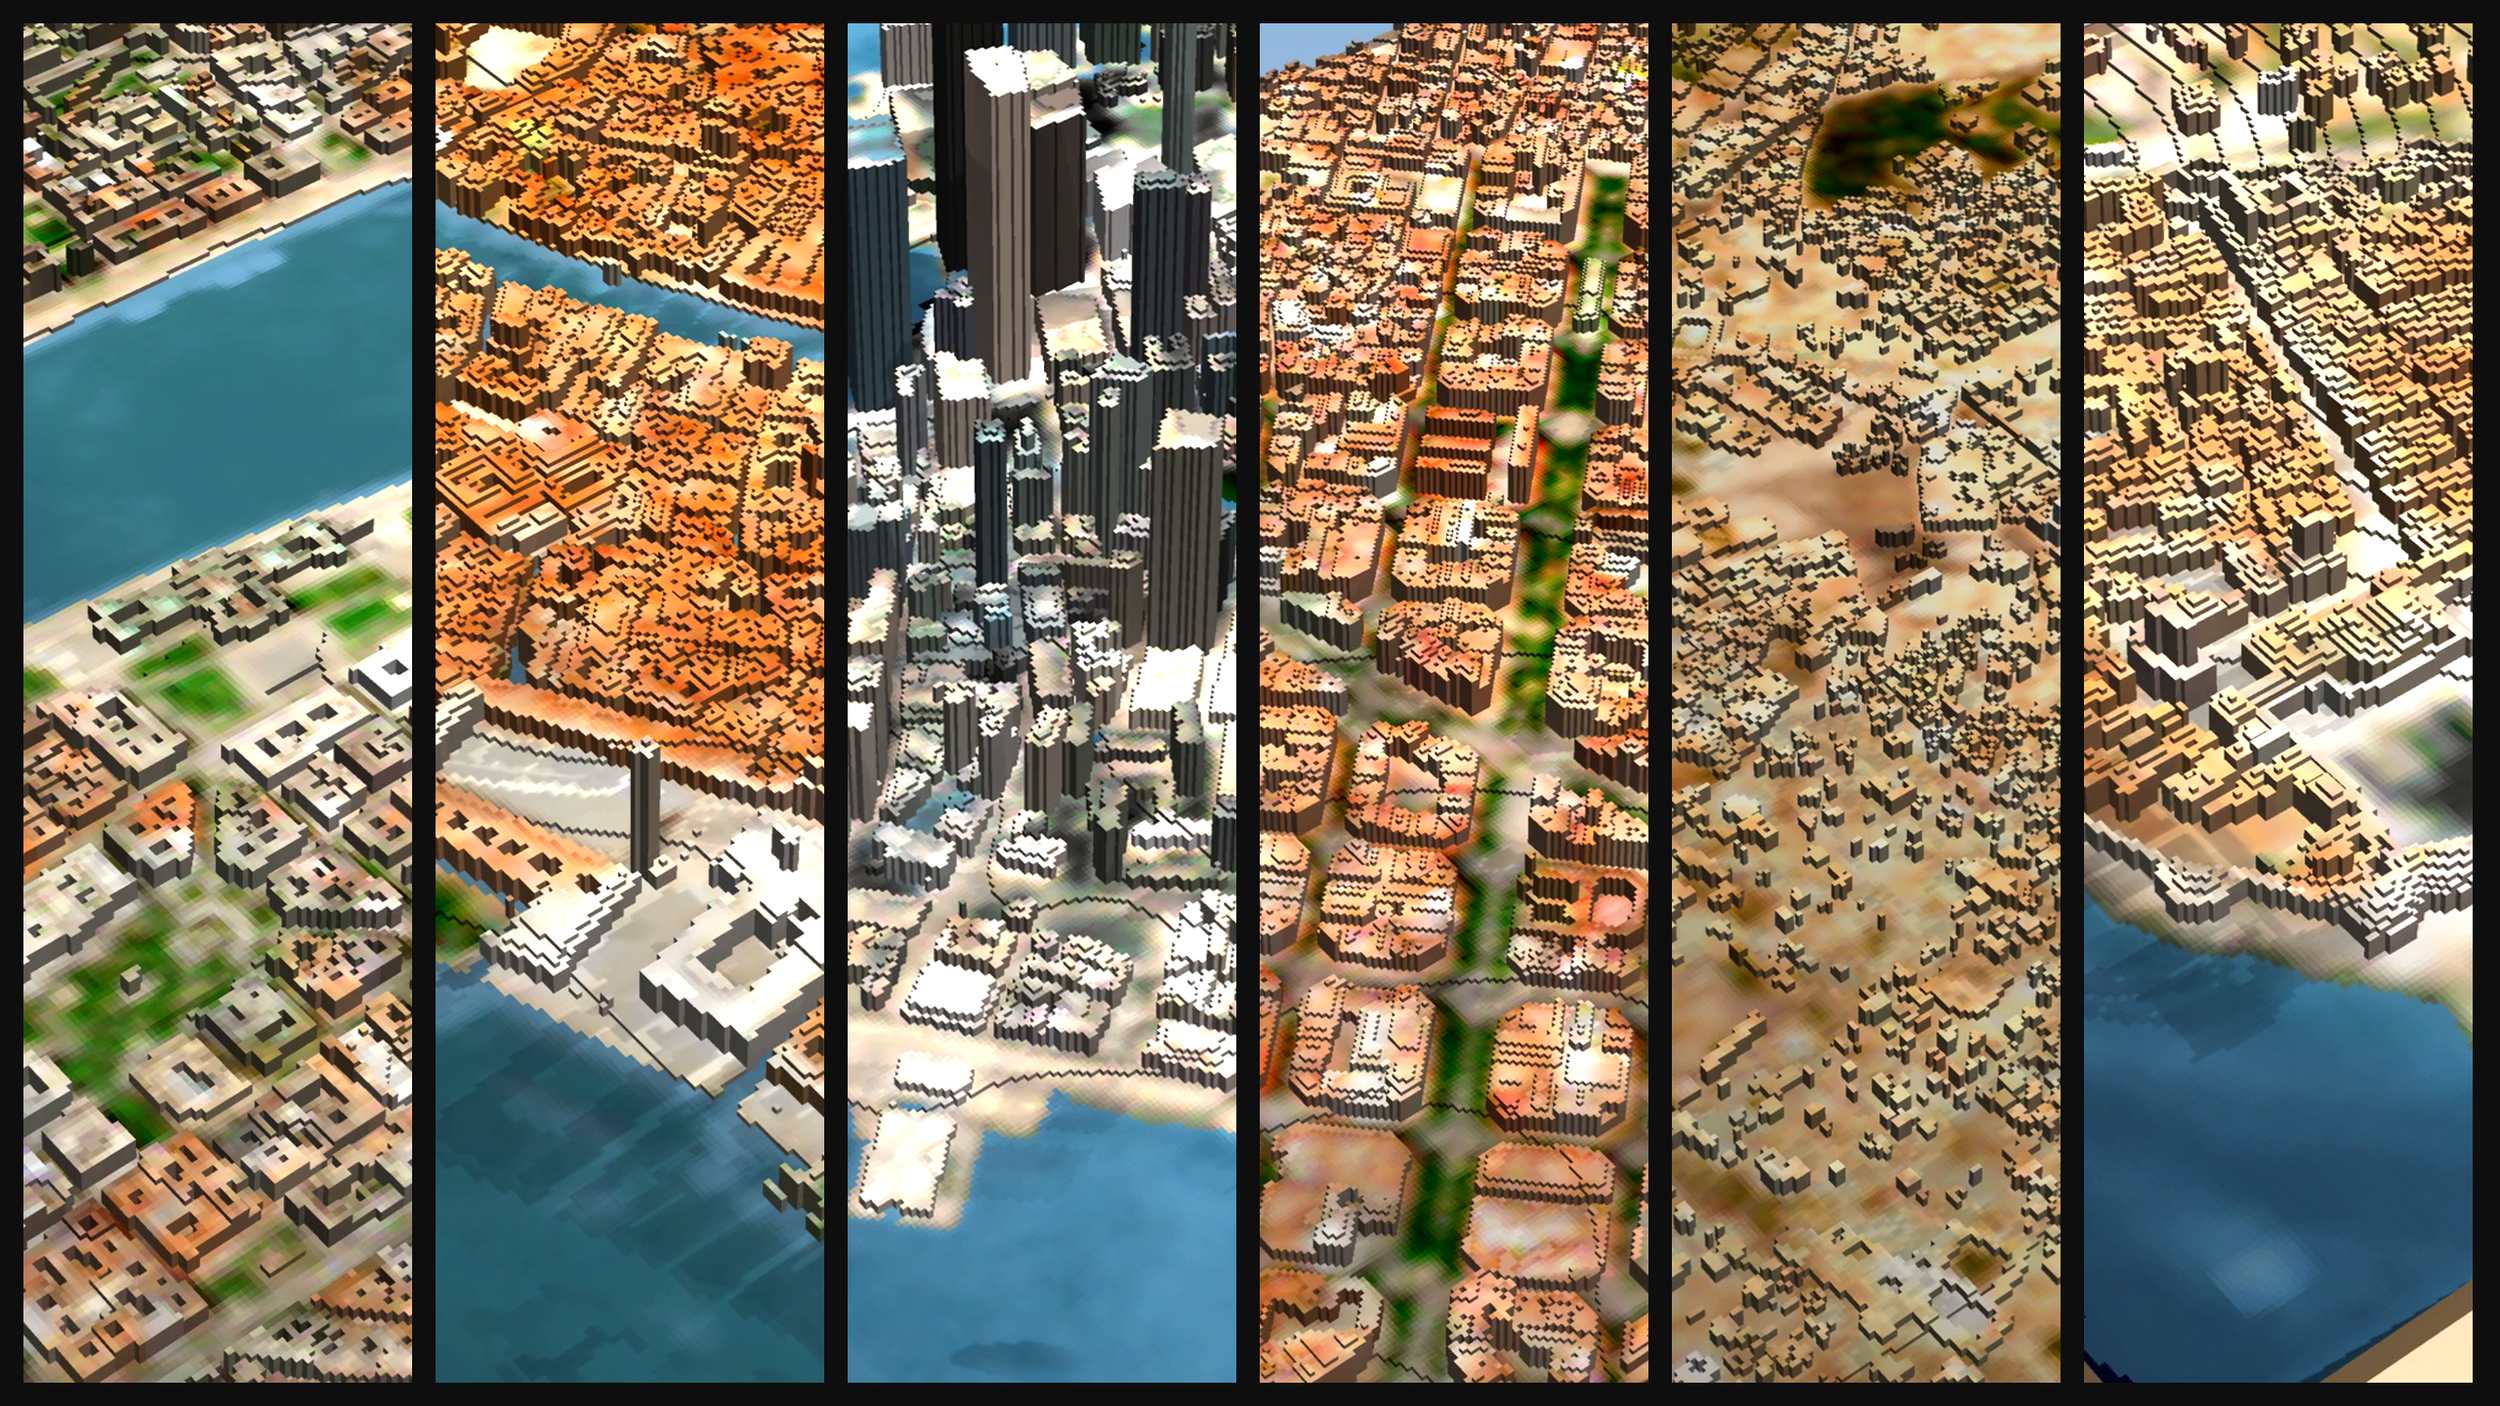
A voxel diorama of a real place is usually several layers stacked on top of each other - in this case, exactly three layers: building footprints and height (mostly) from OSM, ground elevation (DEM) from Copernicus, and colors from Sentinel-2 satellite images. None of it costs anything, none of it needs an API key, and the package fetches all three for you.
Here is what each layer actually contributes, and where each one stops.
Links in the end!
Layer one — OpenStreetMap: the shape of the city
OpenStreetMap gives you the footprints: the outline of most of the buildings, as a polygon. For instance, the Budapest area in the sample notebook covers 1.8 km across the Danube, covering Castle Hill and a slice of Pest — that is 1,276 buildings, plus 606 road segments, the parks, and the river. OSM usually has good coverage in central areas; however, it's not an official registry or measured sensor data, so it will probably never have perfect coverage. By default, it comes in 2D.
Turning a footprint into a 3D building seems to be easy at first - even without unique and expensive digital twin models. You take the polygon, decide how tall it is, and extrude it upwards into a column of cubes on a grid. At the resolution I use, each cube is about 4.7 meters across and the whole tile is 380 by 380 — roughly 97,000 blocks once it is built. This simple column built is a great first approximation, but really not a high-grade digital twin. And the trickiest part is getting building height.
OpenStreetMap has a height tag, and it is exactly what you would want. However, on this tile, 28 buildings carry it. That is 2.2 percent. A further 58 percent carry building:levels — a storey count, which is not a height but converts to one at about 3.2 metres per floor. Everything left over, roughly four in ten buildings, has nothing at all, and gets a seeded fallback between 8 and 18 metres: varied enough that the skyline does not look stamped, and identical every time you run it so your model is reproducible.
Roofs are the same story one level down. Only 29 percent of buildings say anything about their shape, so the package builds a plausible ridge on top of the rest. It reads as a roof. It is invented.
That ratio is why the tool prints the split for every area you load. Central Budapest is well mapped; Manhattan has real tagged heights nearly everywhere; a small town or the Marrakech medina will be mostly inference. Same code, very different amounts of truth, and you should know which one you are looking at.
Layer two — Copernicus DEM: the ground
Buildings standing on a flat plane look like a model kit. Buildings standing on the real shape of the ground look like a place. The Copernicus DEM GLO-30 gives you that shape, globally, at 30 metres, for free. On the Budapest tile it is 138 metres of relief — which is the entire difference between Buda and Pest, and the reason the two halves of the city read as two different cities.
There is a trap in it, and it is the subtlest thing in the pipeline. GLO-30 is a surface model: it measures the top of whatever the satellite saw. In a city, that is the rooftops. The buildings are already baked into the terrain. Put your own buildings on top and you are standing them on copies of themselves.
So the package strips them back out — it finds the sharp, building-shaped vertical jumps and pulls them down to the surrounding ground. On a test tile a 28-metre building came down to 3 metres and stayed down, while a 40-metre hill beside it came down only to 38 and stayed a hill. That is the behaviour you want.
It does fail, and the failure is instructive. At 30-metre postings a tall narrow tower and a small steep hill are not always distinguishable. In Manhattan the filter read a cluster of towers as topography and left me a 114-metre hill that does not exist. Every synthetic test passed while that hill was sitting there — real elevation data caught it, clean test data never would have.
Layer three — Sentinel-2: the colour
This is the only layer that is actually measured rather than inferred, and it is the one that transforms the result.
Sentinel-2 passes over every few days and gives its imagery away. The package finds the least cloudy recent scene, samples a colour for every cell in the grid, and paints it onto the voxels. Terracotta roofs come out terracotta. The Danube comes out the specific grey-green the Danube is. Parks are green because they are green, not because a stylesheet decided parks are green.
Two things happen quietly, because the naive version looks wrong. Some roof pixels sample a shadow or the water instead of the roof — there were 1,153 of those on this one tile, and they get repaired. And the satellite finds water the map never tagged, which gets added back.
Sentinel’s bands land at 10 metres, which is why the pixelated look is honest rather than a style choice: that genuinely is the resolution of the colour information underneath.
What the diorama can actually do
The main output is a single self-contained HTML file. No server, no dependencies, works offline, survives being emailed. Drag to orbit, scroll to zoom — and then type into the command box in the corner.
night turns the lights on across the city. 2d squashes every building flat onto the terrain, so the tile becomes a printed map — this is the one worth trying first, because it shows you exactly what the third dimension was buying you. taller exaggerates the heights, up to four times, which makes the shape of the skyline legible. sun june, sun 8am and sun winter put the real sun in the sky for that latitude and date and cast the shadows that follow from it, with a slider to scrub through the day. buildings off, water off, clouds on and satellite off peel the layers apart one at a time.
The same scene also exports as an orbiting GIF, a still image, a vertical clip, and — because it is a voxel model and the temptation was irresistible — a Minecraft datapack that builds the city block by block when you load the world.
Six cities ship as worked examples, chosen because each one breaks the model somewhere different: Budapest for the river and the hills, Dubrovnik for small and steep, Manhattan for real tagged heights, Barcelona for the Eixample grid, Marrakech for organic density, and Venice — the hardest — for a city whose streets are water.
It is a visual model, not a survey. But it is built from three open datasets, it runs in a notebook, and it will always tell you which parts it measured and which parts it made up.
Watch the full build:
The package and the notebook: https://janosovm.gumroad.com/l/voxel-city
