Urban Data Science
Read a city as data, then model it.
Who this is for
You work in planning, real estate, retail, mobility, or the public sector and want to produce your own city analyses rather than commission them. Or you are a data scientist who has just realised that half your problems have a "where" in them. This is the journey for cities, OpenStreetMap, and spatial modelling at the level of individual buildings.
Assumes: the Getting Started journey, or equivalent — comfortable Python and a first contact with GeoPandas and OpenStreetMap.
By the end you can
Acquire any city on Earth from OpenStreetMap — boundaries, buildings, roads, amenities — and turn it into a reusable urban profile.
Measure accessibility across a real street network: isochrones, walkability, the 15-minute city.
Solve a site-selection problem with spatial clustering, and defend the answer.
Build a livability index and a price model at building-footprint resolution, and know exactly how subjective the first one is.
Analyse the networks underneath all of it — hubs, communities, structure — in NetworkX.
How to follow this journey
Go in order. Each step assumes the one before it — the route is the prerequisite chain, not a ranking.
Step 1 is a free eight-minute video and the Introduction has a free sample. Try the sample's first chapter on the city you know best before you buy.
On paid steps, Learn more opens the course or book page; Start the course / Get the book goes straight to Gumroad, where most items have a free sample.
Going deeper is optional and unordered — a shelf, not a route. Come back to it after the last step, or whenever a step raises a question.
The route
6 steps · 3 free · roughly 9 hours of video
1. Interactive Road Traffic Accident Map in Python
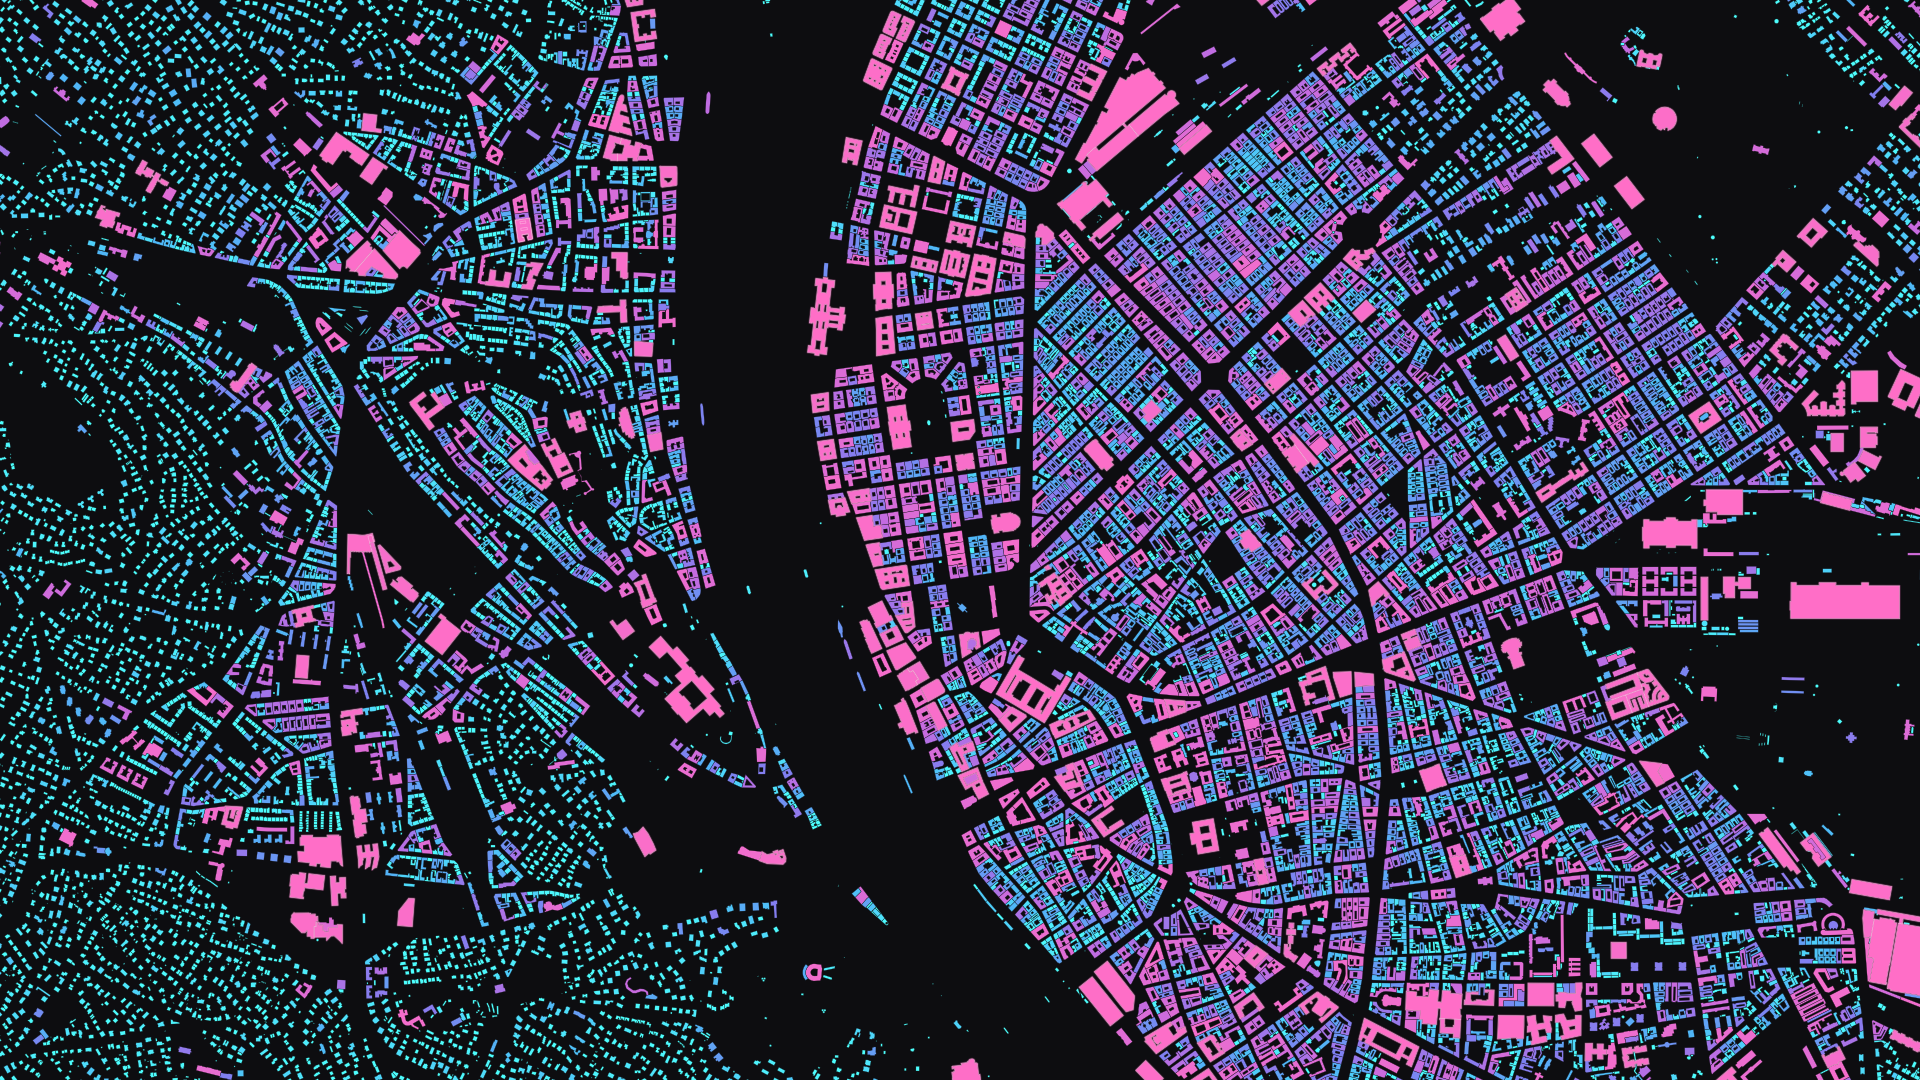
A real city in under ten minutes: nearly 100,000 Budapest street segments, coloured by accident statistics, interactive in Folium. Everything the first course teaches at depth, shown once, fast.
Watch → · Read the write-up* → Free video · 8 min
2. Urban Analytics with Python: An Introduction
Vienna, from an empty environment to a citywide livability index. Boundaries, points of interest, building footprints by function and by height, road networks as graphs — every layer acquired by you, every lecture built line by line. The pipeline is yours to point at any city.
Learn more → · Start the course → Course · ~2.5 h
3. How Walkable Is Your City?
The bridge between the two courses. The Introduction ends on a livability score by district; this asks the same question at street level, across four capitals, measured along the network rather than as the crow flies.
Watch → · Read the write-up* → Free video · 29 min
4. Urban Analytics with Python: Advanced Methods
Manhattan, roughly 50,000 buildings, five real use cases: site selection with DBSCAN and KMeans, accessibility with Pandana and GTFS, a greenery score from parks plus satellite NDVI, a persona-based livability index, and a spatial-lag price model. The introduction taught you to read a city; this one teaches you to model it.
Learn more → · Start the course → Course · ~2.5 h
5. Mapping NYC Subway Accessibility
The accessibility chapter, extended to the entire subway system: an isochrone for every station, animated five seconds of walking at a time. It is also where the network underneath the city stops being a means and becomes the subject.
Watch → · Read the write-up* → Free video · 28 min
6. Network Analytics & Visualization in Python
From your first graph object to comparative analytics against random references. Centralities, communities, synthetic benchmarks, and the bridge into Gephi. The Advanced course used networks to measure accessibility; this is where you learn what they are.
Learn more → · Start the course → Course · ~3 h
Going deeper
Optional, any order.
Budapest Transit Accessibility from GTFS
The transit thread on a 100,000-node walkability graph, one map per mode.
Watch → · Read the write-up* → Free video · 15 min
OpenStreetMap vs Global Building Atlas
When OSM footprints are not enough: a second global building source, compared honestly.
Watch → · Read the write-up* → Free video · 12 min
Overture vs OSM Building Footprints
The third source. With the two above, you have seen all three.
Read* → Tutorial
I Mapped 40 Years of Budapest's Heat From Space
Urban heat islands from the Landsat archive.
Watch → · Read the write-up* → Free video
I Mapped Who Actually Lives in Budapest's Heat
The follow-up: 702 hexagons, twenty years of warming, and the people standing in it.
Watch → · Read the write-up* → Free video
The Shadow Map — All of Budapest in One Second
Every building's shadow, every fifteen minutes, on a laptop CPU.
Watch → · Read the write-up* → Free video
Identifying Topical Hot Spots in Urban Areas
The DBSCAN method from the Advanced course, on a different question.
Read* → Tutorial
Assessing Urban Green Equality
Green space per person against income, district by district, in Vienna.
Read* → Tutorial
20 Urban Analytics Concepts Every Analyst Should Know
The vocabulary of both courses, in one place.
Read* → Reference
20 Urban Heat & Heatwave Papers
Elective reading behind the heat tutorials.
Read* → Reading list
Geospatial Data Science for Urban Planning
The research backdrop of the whole journey.
Read* → Reading list
* Part of my premium Substack plan.