Urban Analytics with Python
Advanced Methods From Spatial Modeling to Complex Neighborhood Indicators
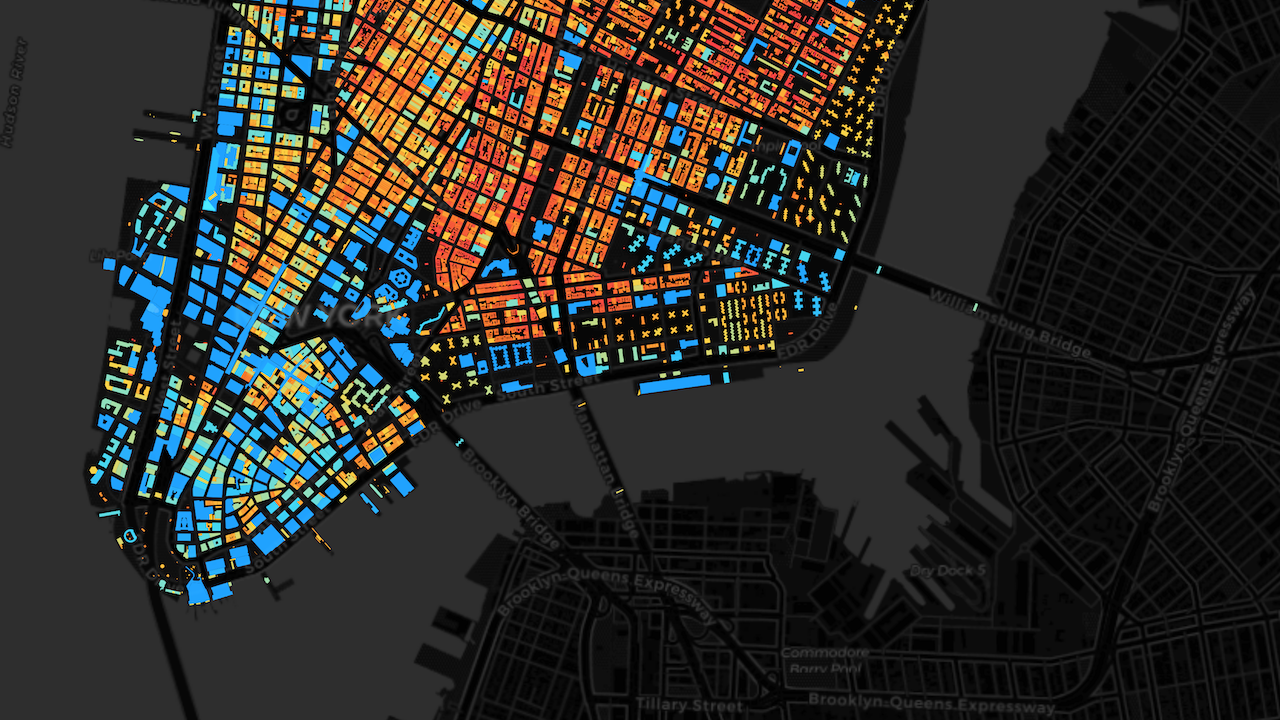
From Spatial Modeling to Complex Neighborhood Indicators
The introductory course taught you to read a city as data. This one teaches you to model it. Working across the entire island of Manhattan — roughly 50,000 building footprints — you build detailed features at the level of individual buildings and combine them with spatial machine learning, network accessibility, and satellite data. Five real commercial use cases, one richly analyzed city, and a complete advanced pipeline you can point at your own.
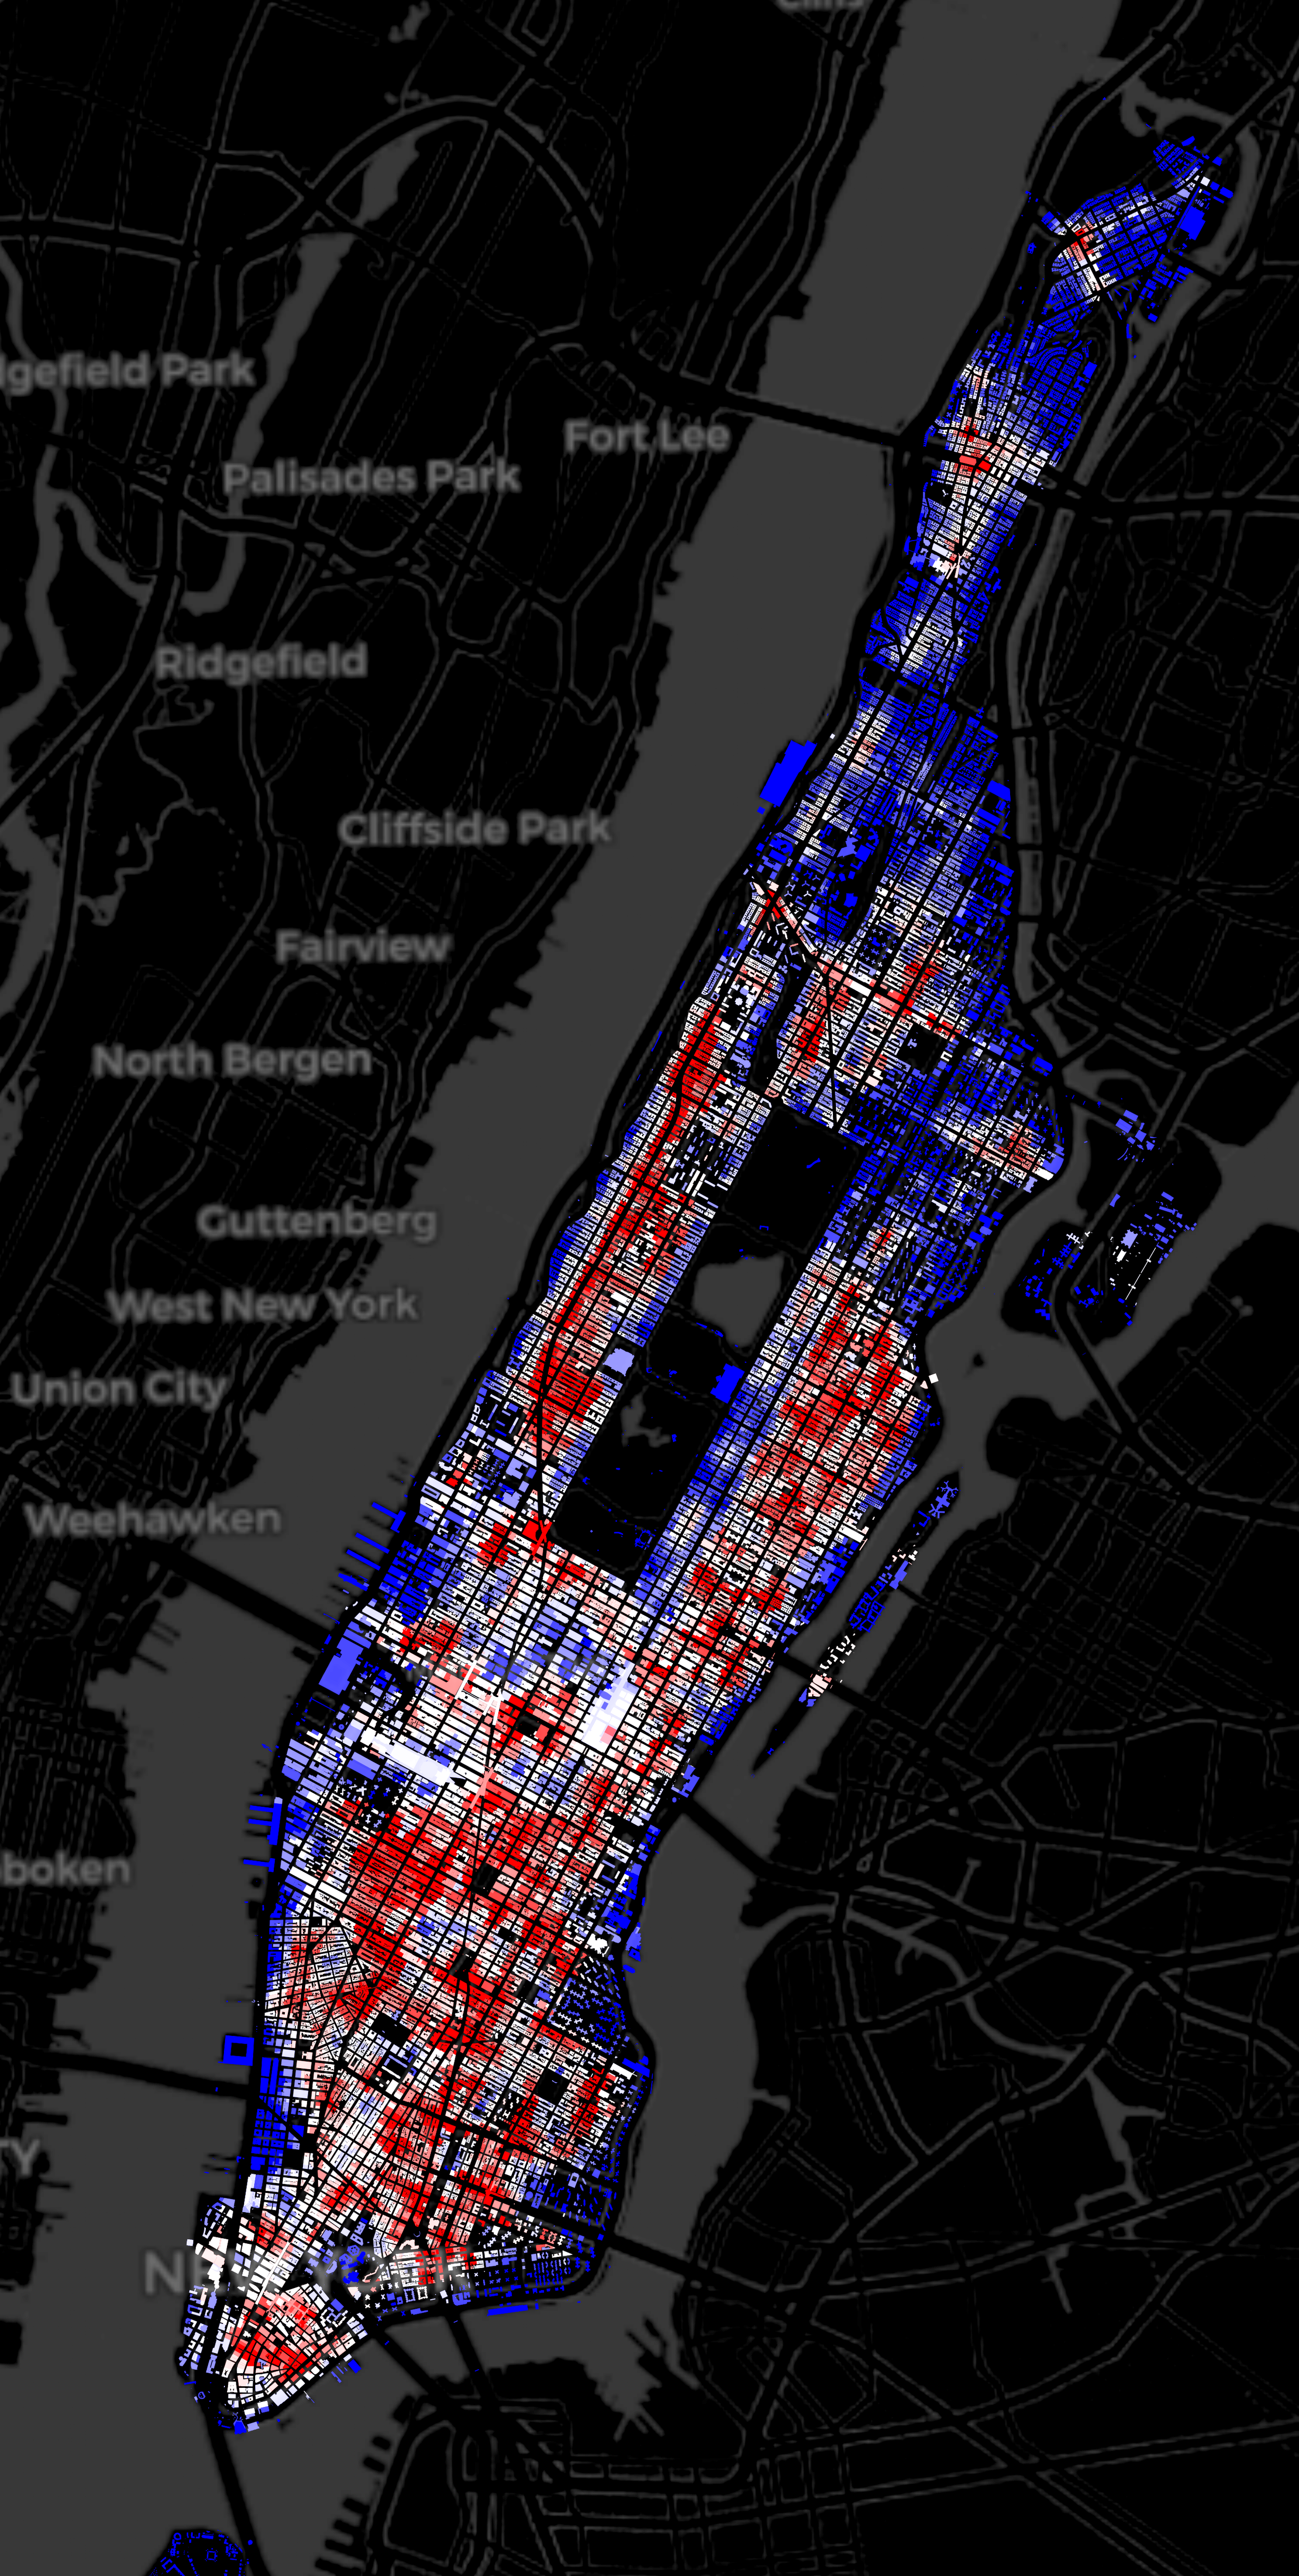
WHAT THIS IS
A professional-level, build-alongside course in spatial modeling. Rather than touring many techniques shallowly, it goes deep on one study area and layers five genuine use cases on top of it — each producing a real, decision-relevant output. Everything is computed at building-footprint resolution and carried forward chapter to chapter, so by the end every one of Manhattan's ~50,000 buildings carries accessibility, greenery, livability, and price features you built yourself. Every framework is written to be flexible: swap the amenity, the persona, or the city and rerun it.
WHAT YOU'LL BUILD
Six chapters, five real use cases, all at building-footprint level.
Site selection with spatial clustering. Answer a real commercial question — where should a new venue (the example: a matcha shop) open? — by combining two complementary ML methods: DBSCAN to find organic POI agglomerations, and KMeans to assign functional typologies to a derived grid, layered into a shortlist of candidate sites.
[VISUAL: the final site-selection shortlist map — candidate grid cells highlighted across Manhattan, from Chapter 2.]
Urban accessibility and the 15-minute city. Measure distance across the road network, not as the crow flies. Parse subway data from GTFS, compute walkability surfaces and reachability isochrones with Pandana, and map walking-minutes to every building.
[VISUAL: the walkability surface or the onion-layer isochrones from a subway stop, from Chapter 3.]
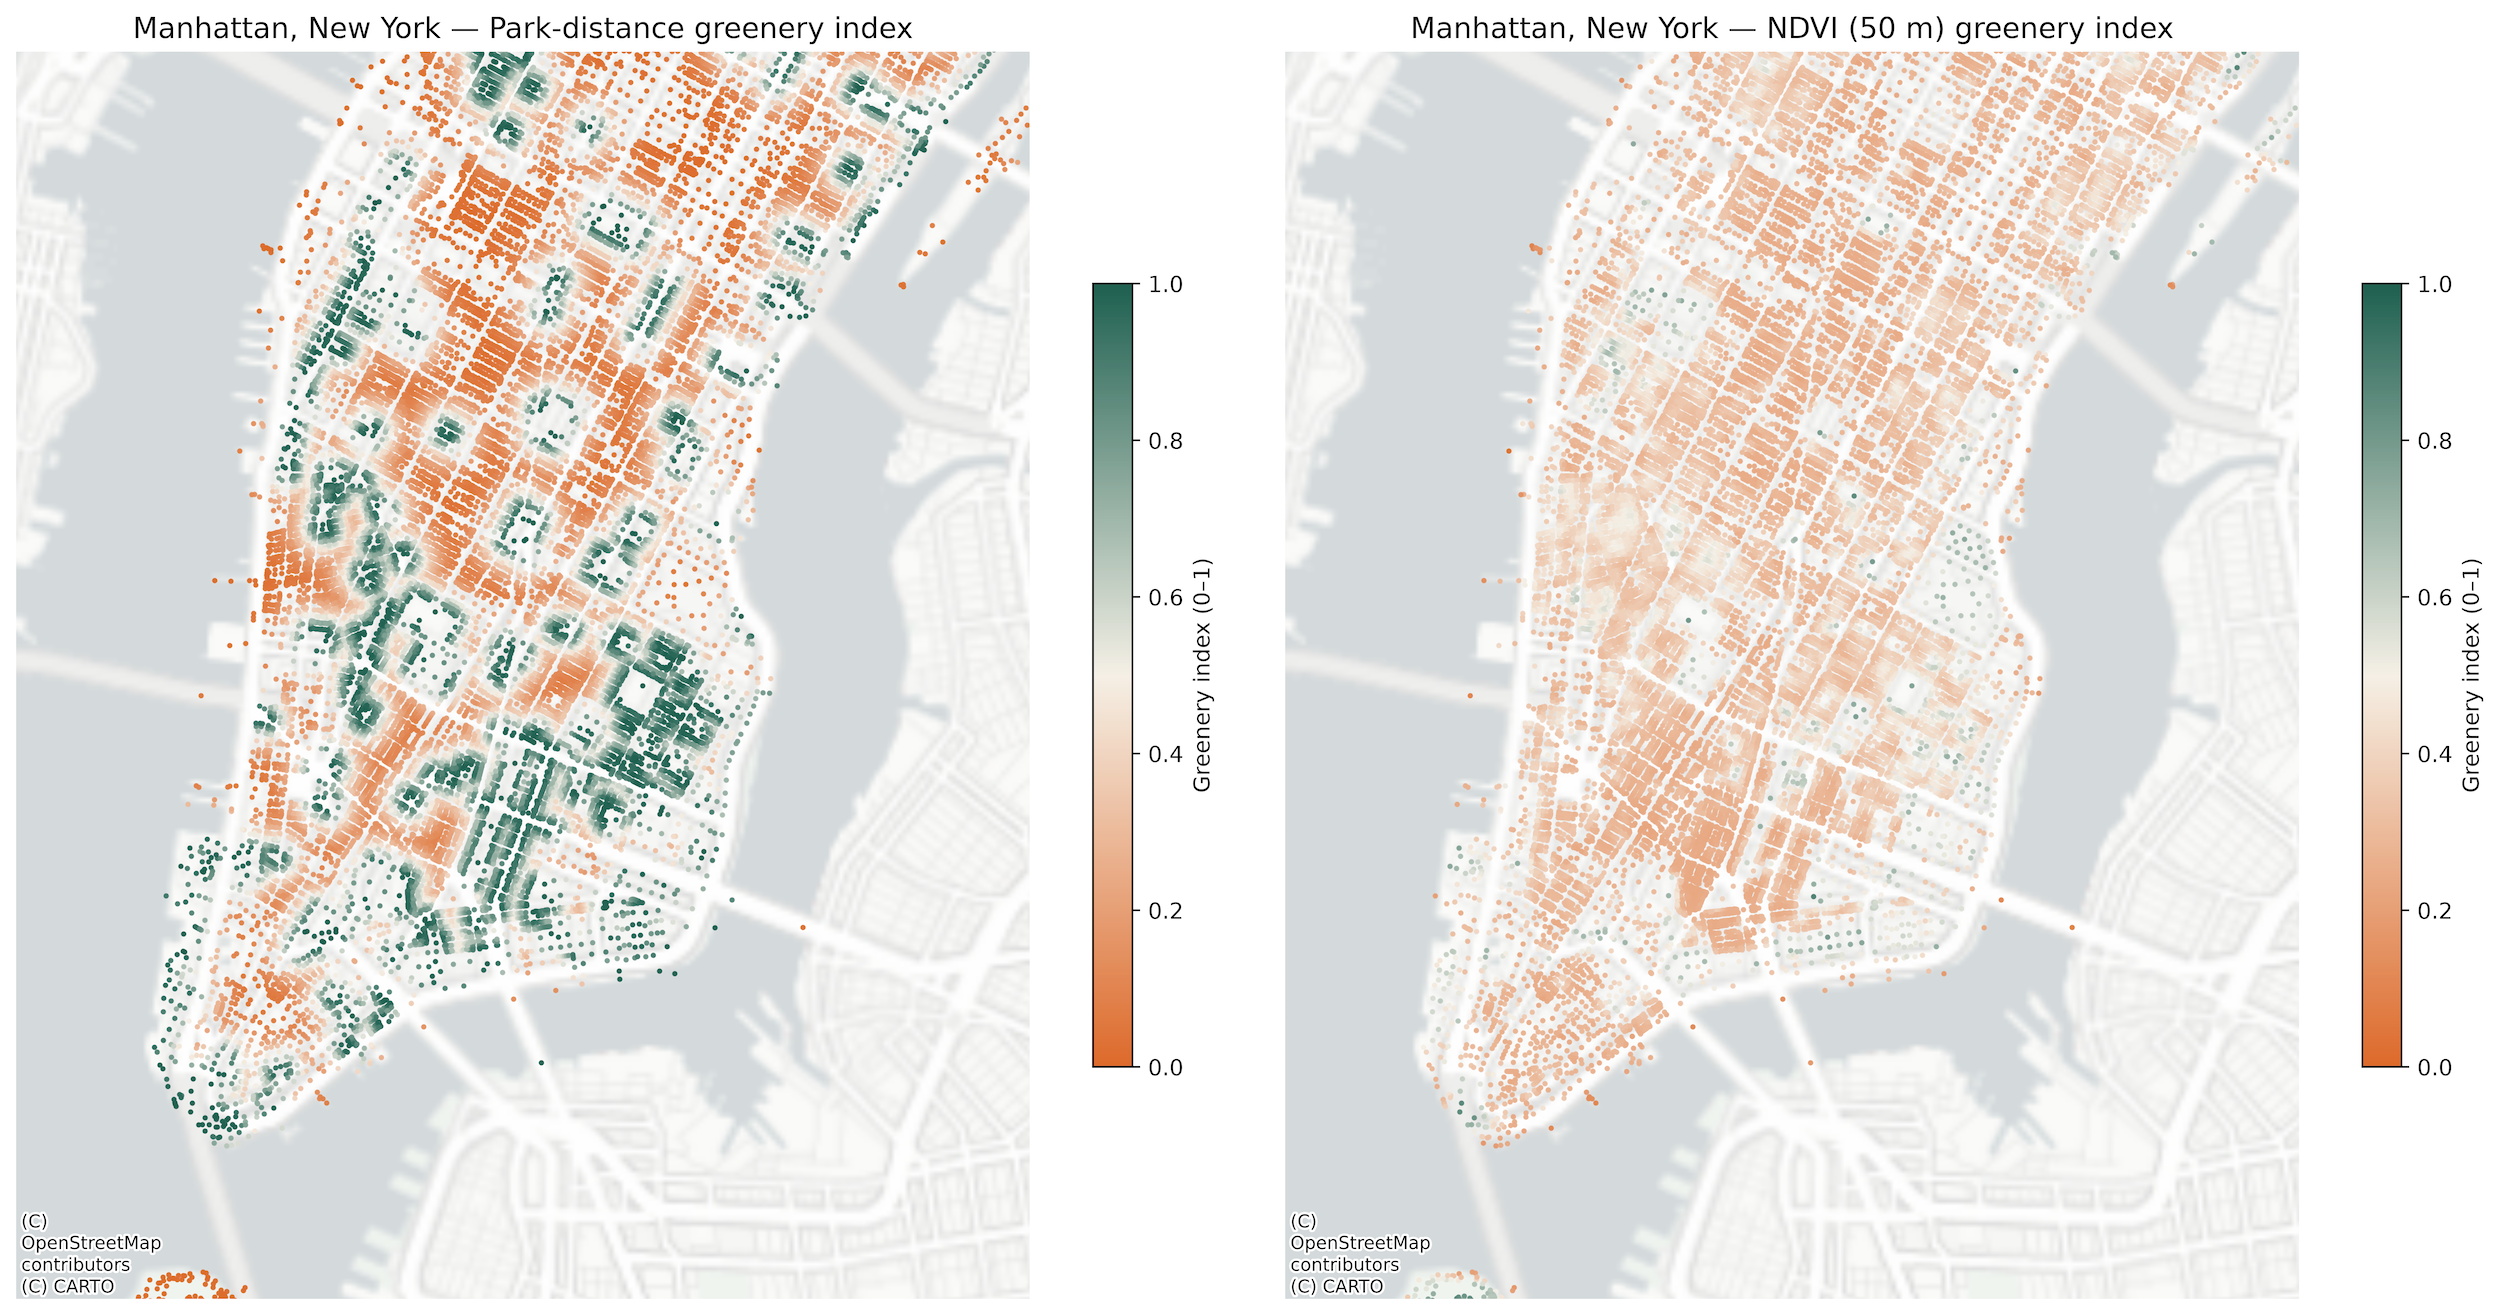
A composite greenery score. Fuse official NYC park polygons with Sentinel-2 satellite NDVI at 10-metre resolution — formal green space plus the ambient green all around you — into one tunable greenery score per building.
[VISUAL: the contrast-enhanced NDVI map of Manhattan (Central Park glowing) or the combined greenery map, from Chapter 4.]
A persona-based livability index. Define a custom persona (a car-free Manhattan professional), weight the amenities that matter to them, and compute a 1–10 livability score for every block and every building.
[VISUAL: the interactive two-layer livability map — grid and buildings — from Chapter 5.]
A real-estate price model. Bring every feature together, add a real sales dataset, and train two models — an OLS baseline and a spatial-lag regression — to predict a price-per-square-foot surface for every building in Manhattan.
WHO THIS IS FOR
You've done the basics of geospatial Python — you can acquire and map OSM data — and you're ready for real spatial modeling.
You work in urban planning, real estate, retail, or site selection and want defensible, reproducible methods behind your decisions.
You're a data scientist moving into spatial problems and want to add clustering, network accessibility, satellite analysis, and spatial regression to your toolkit.
You're a researcher or advanced student who needs a complete, from-scratch, building-level pipeline you fully understand and can adapt.
You learn by building — you'd rather construct a livability index and a price model than read about them.
WHAT YOU'LL LEARN
By the end of this course you can:
Build a rich set of urban features at the level of individual building footprints, across an entire city.
Solve a site-selection problem with two complementary clustering methods — DBSCAN for organic agglomerations, KMeans for functional typologies — and choose K rigorously with inertia and silhouette scores.
Quantify urban accessibility across a road network with Pandana: walkability surfaces, reachability isochrones, and per-building walking-time features.
Turn GTFS transit feeds into usable geospatial data for any city.
Acquire and process Sentinel-2 satellite imagery, compute NDVI, and fuse it with official open data into a composite environmental score.
Define a persona and build a weighted, adjustable livability index at both grid and building resolution.
Train and compare ordinary and spatial-lag regression models, understand where spatial dependence helps (and where it doesn't), and predict a citywide price surface.
Take any of these flexible frameworks and rerun them on a different amenity, persona, or city.
COURSE STRUCTURE
1. Introduction, Study Area — The Manhattan study area, the environment, and ~50,000 building footprints as the core unit of analysis.
2. POI Site Selection via Spatial Clustering — DBSCAN agglomerations, a grid sized from them, POI feature engineering, KMeans typologies, and a combined site-selection shortlist.
3. Urban Accessibility — GTFS transit parsing, walkability surfaces and isochrones with Pandana, mapped to building footprints.
4. Urban Green Spaces — Park accessibility, Sentinel-2 NDVI, and a combined composite greenery score per building.
5. Walkability-Based Livability — A car-free persona, per-unit accessibility features, and a 1–10 livability index across grid and buildings.
6. Real Estate: Price Modeling via Spatial Regression — Per-building features, a price-per-square-foot target, OLS and spatial-lag regression, and a price surface for every building.
WHAT'S INCLUDED
🎬 ~2.5 hours of video lectures on the New Science of Maps platform
📓 Two versions of every Jupyter notebook — a commented standalone version and the exact recorded version
🛰️ Real datasets: OpenStreetMap, NYC open data, GTFS transit, and Sentinel-2 satellite
🤖 Full spatial-ML pipeline: DBSCAN, KMeans, and spatial-lag regression
♾️ Lifetime access, including future updates
PREREQUISITES / WHO IT'S NOT FOR
Prerequisites: comfortable Python and familiarity with the core geospatial stack (GeoPandas, OSMnx, rasters, CRS). An intermediate course that builds real models on top of the basics.
Recommended companions: new to spatial Python? Start with Urban Analytics with Python: An Introduction first. The book Geospatial Data Science Essentials: 101 Practical Python Tips and Tricks is a useful reference alongside it. This course touches spatial networks and accessibility — to go deeper on graphs, see Network Analytics in Python.
Not for you if: you're new to spatial data in Python (start with the Introduction), or you want a single deep-method theory course rather than a broad applied pipeline.
INSTRUCTOR
Taught by Milan Janosov — geospatial data scientist and network scientist (PhD). You build alongside a working scientist, on real data, with the practical judgment that turns raw urban data into decisions you can defend.