Network Analytics & Visualization in Python:
From Graphs to Insights
Build, analyze, and visualize real networks in Python — from your first graph object to publication-ready insight.
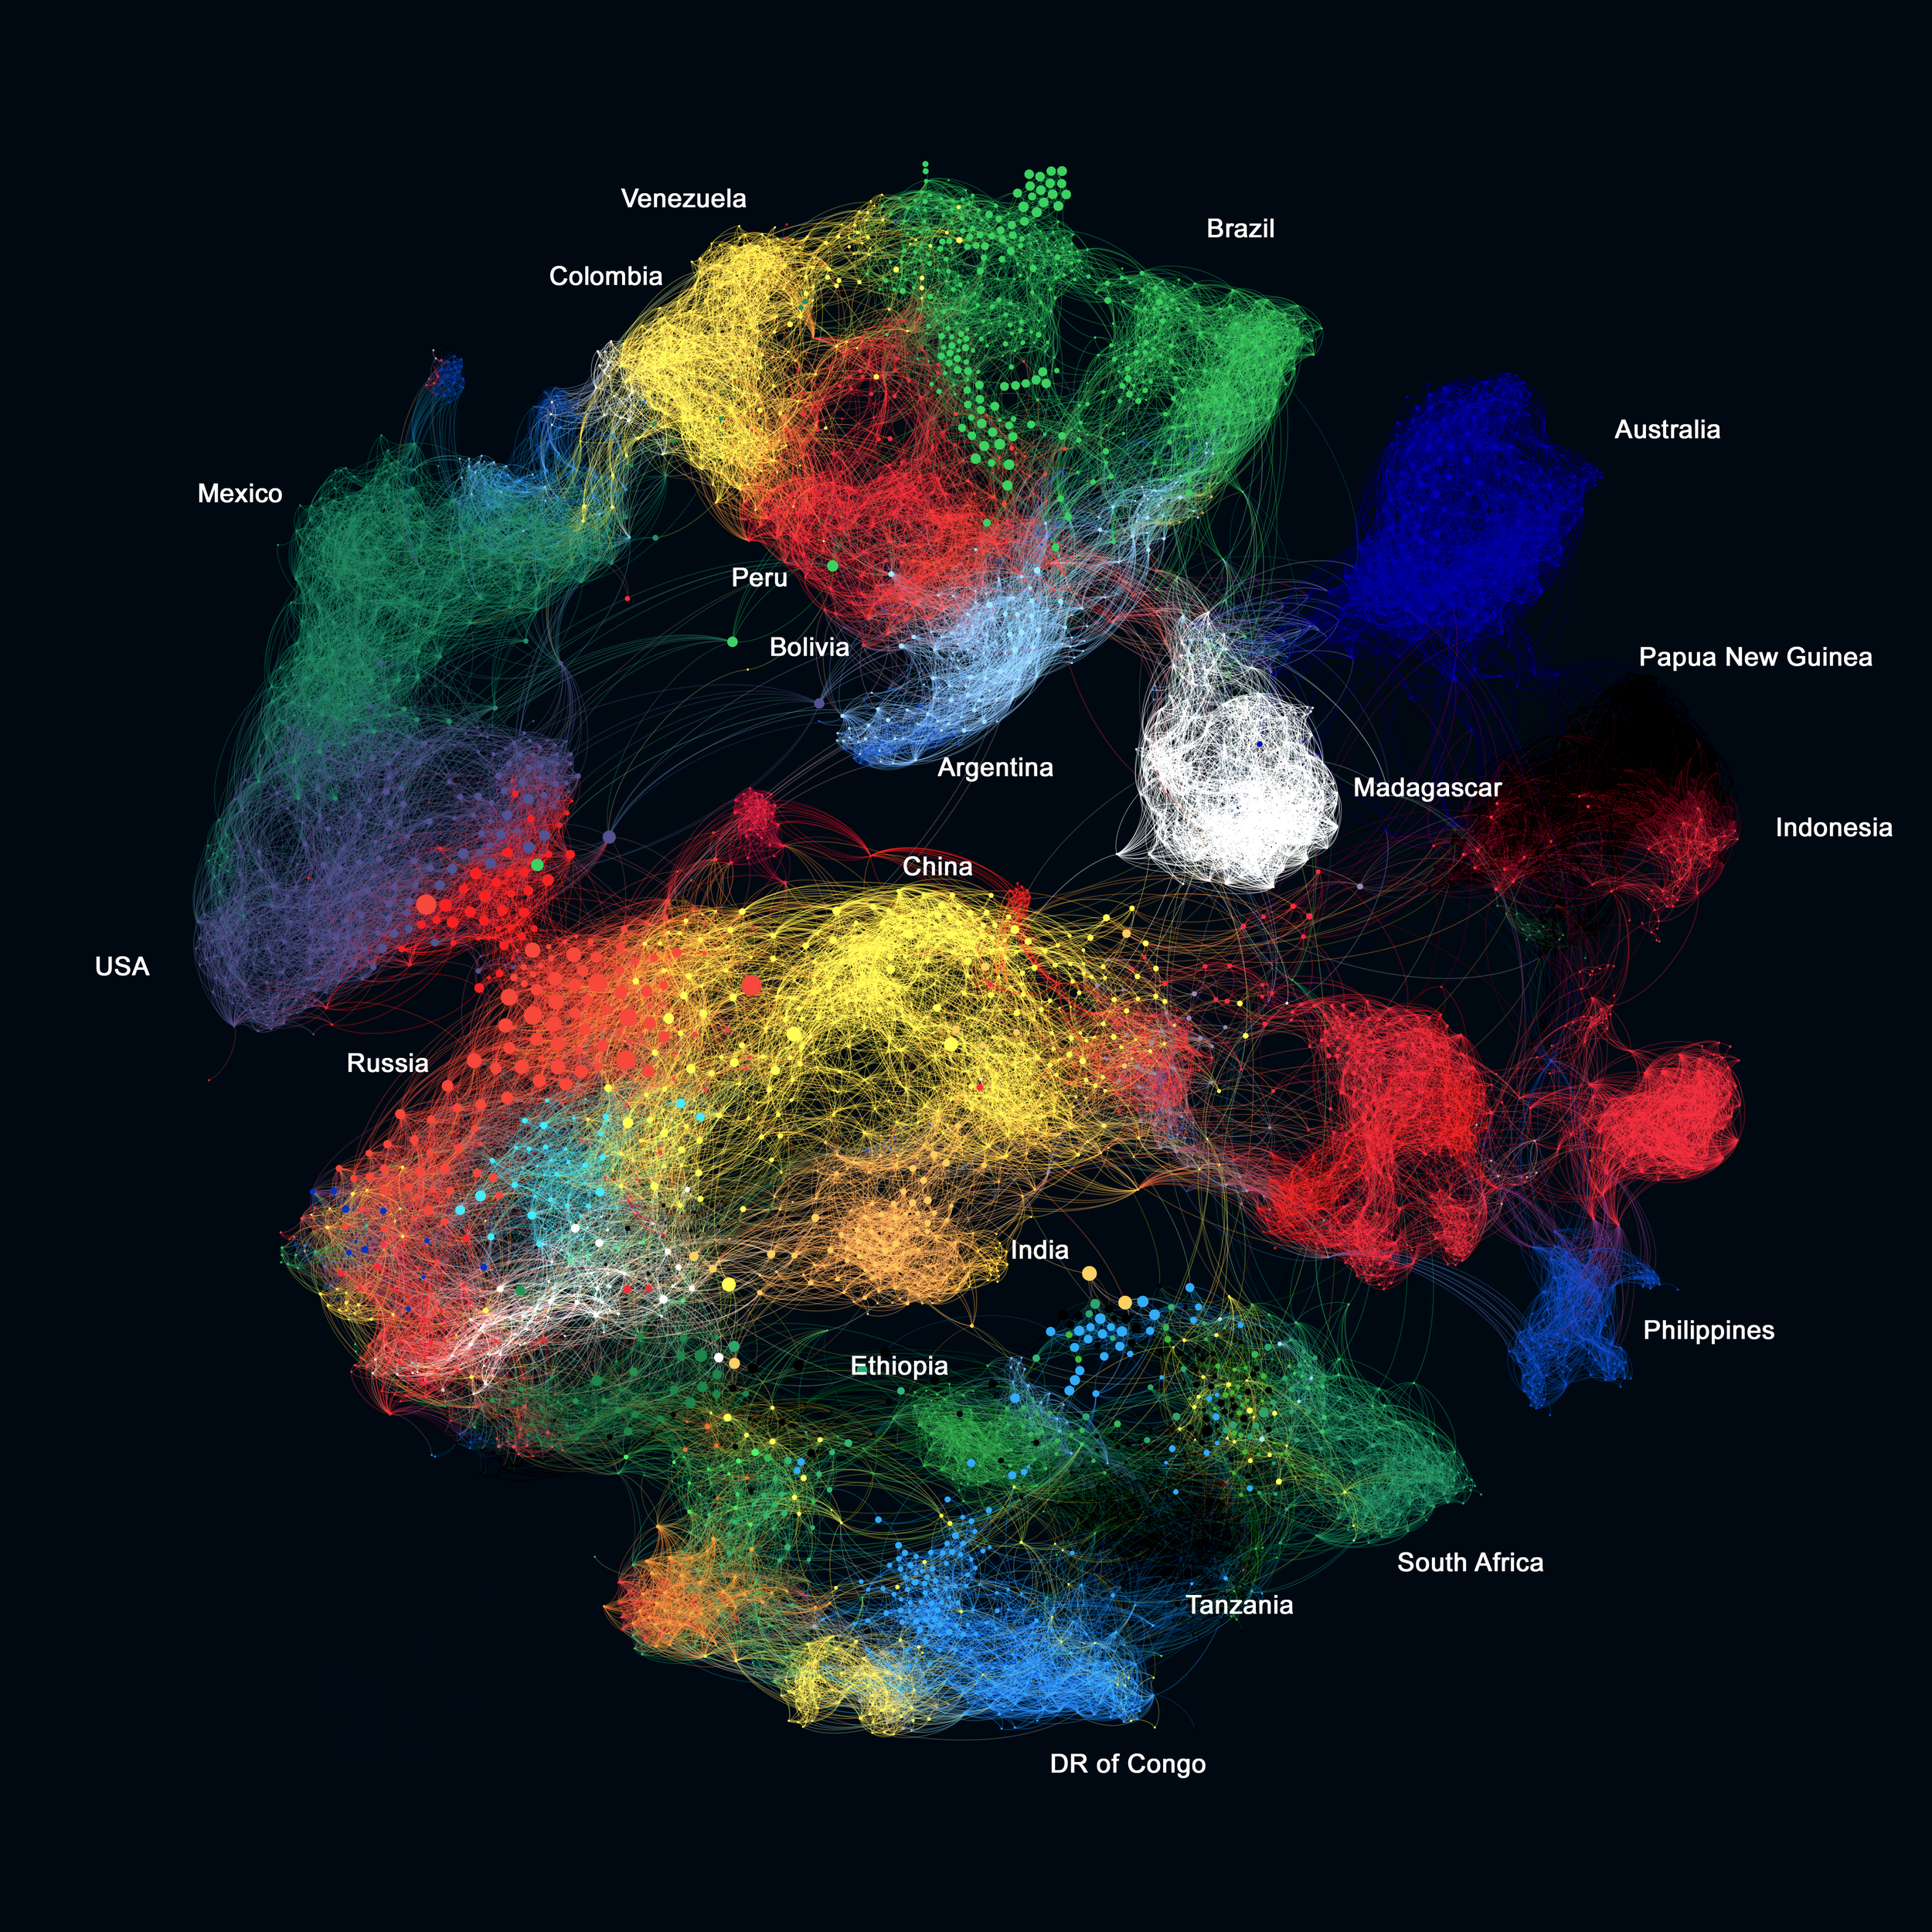
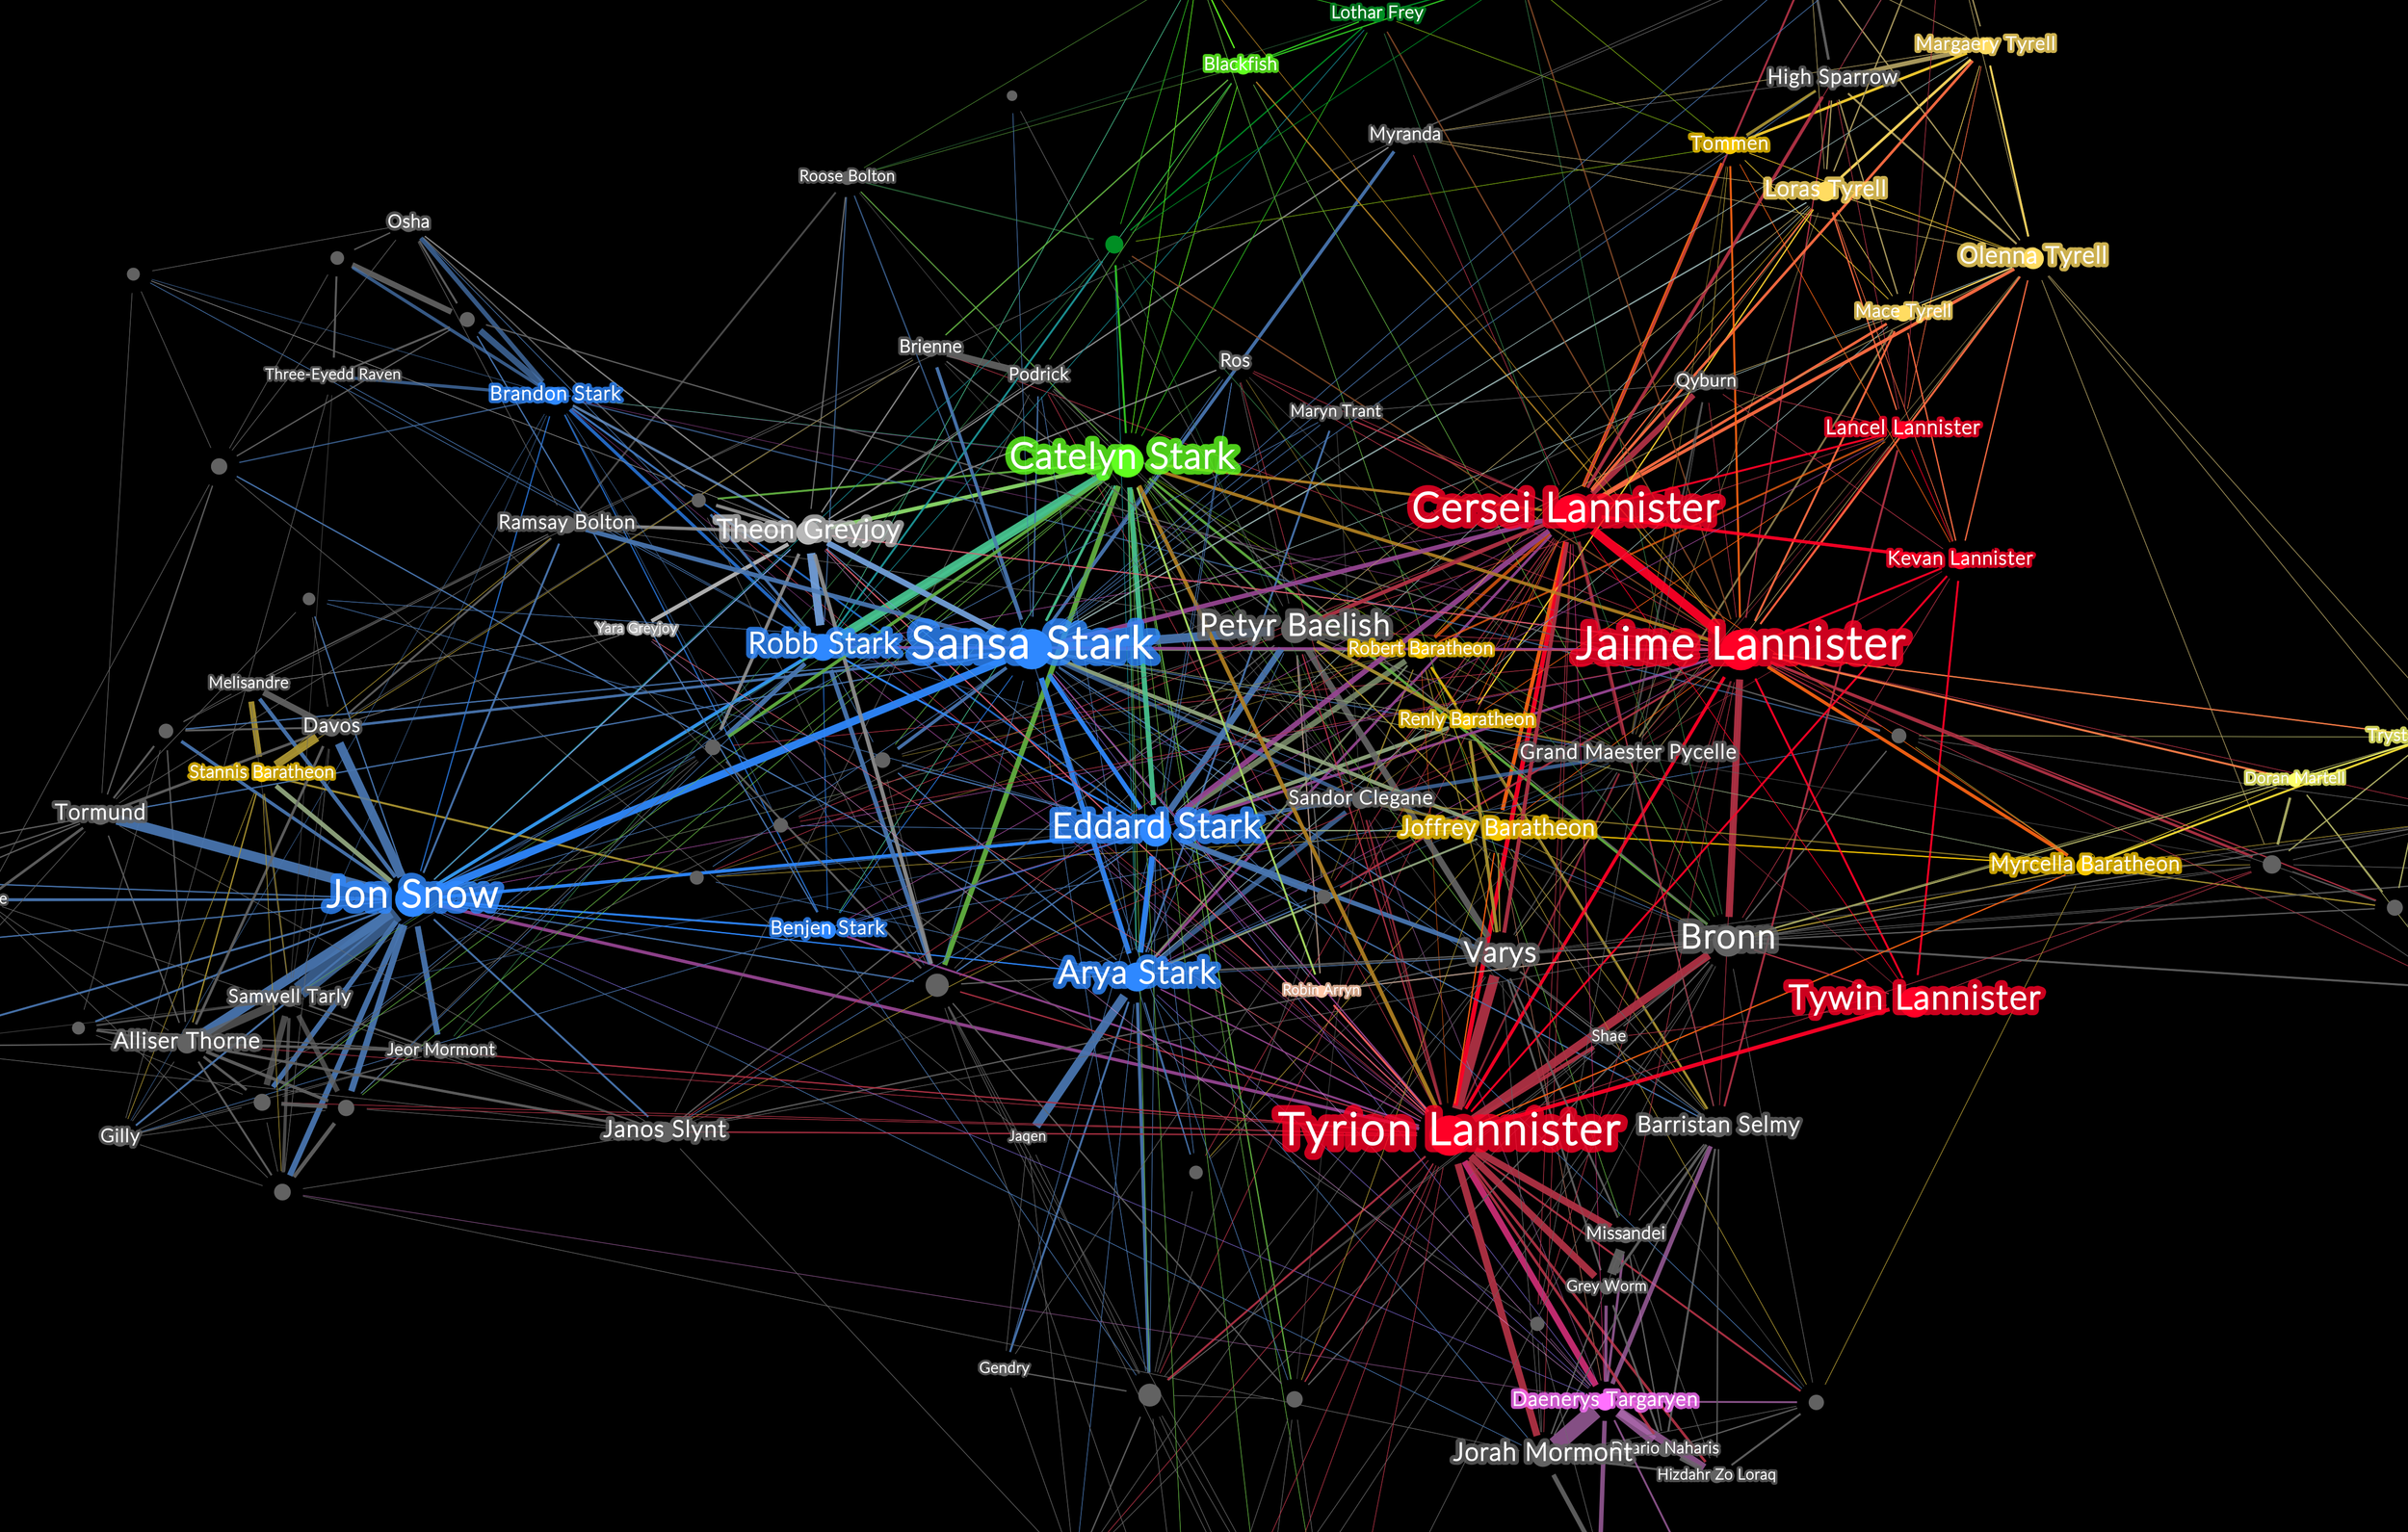
Relational data is everywhere — who connects to whom, what links to what — but a table of connections isn't insight. Network analytics is how you turn that raw relational data into something you can actually read: the hubs, the communities, the structure. This course gives you the practical foundation to build, analyze, and visualize real networks in Python from scratch, in NetworkX, and to bridge into Gephi when you want the visual polish.
WHAT THIS IS
A hands-on, code-first introduction to network analytics. You start by creating your very first graph object and end by running comparative analytics against null models and generating your own synthetic benchmark networks. Everything is in Python (NetworkX + Matplotlib), with a bridge to Gephi for visual exploration. Basic Python is assumed; no network science background is needed — the concepts are built as you code them.
WHAT YOU'LL BUILD
Four modules that take you from an empty graph to real analytical insight.
Your first graphs in NetworkX. Create graph objects, add nodes and links, draw your first networks, and build every graph type that matters — undirected, directed, weighted, unweighted — then load real networks from lists, spreadsheets, and GEXF files.
[VISUAL: the four-quadrant graph-types figure — undirected/directed × weighted/unweighted.]
The analytics toolkit. Lay out networks with different algorithms, compute and interpret the core centralities — degree, PageRank, betweenness, clustering — analyze network statistics and degree distributions, detect communities with modularity, and visualize it all in Python.
[VISUAL: the centralities summary plot (degree / PageRank / betweenness / clustering side by side).]
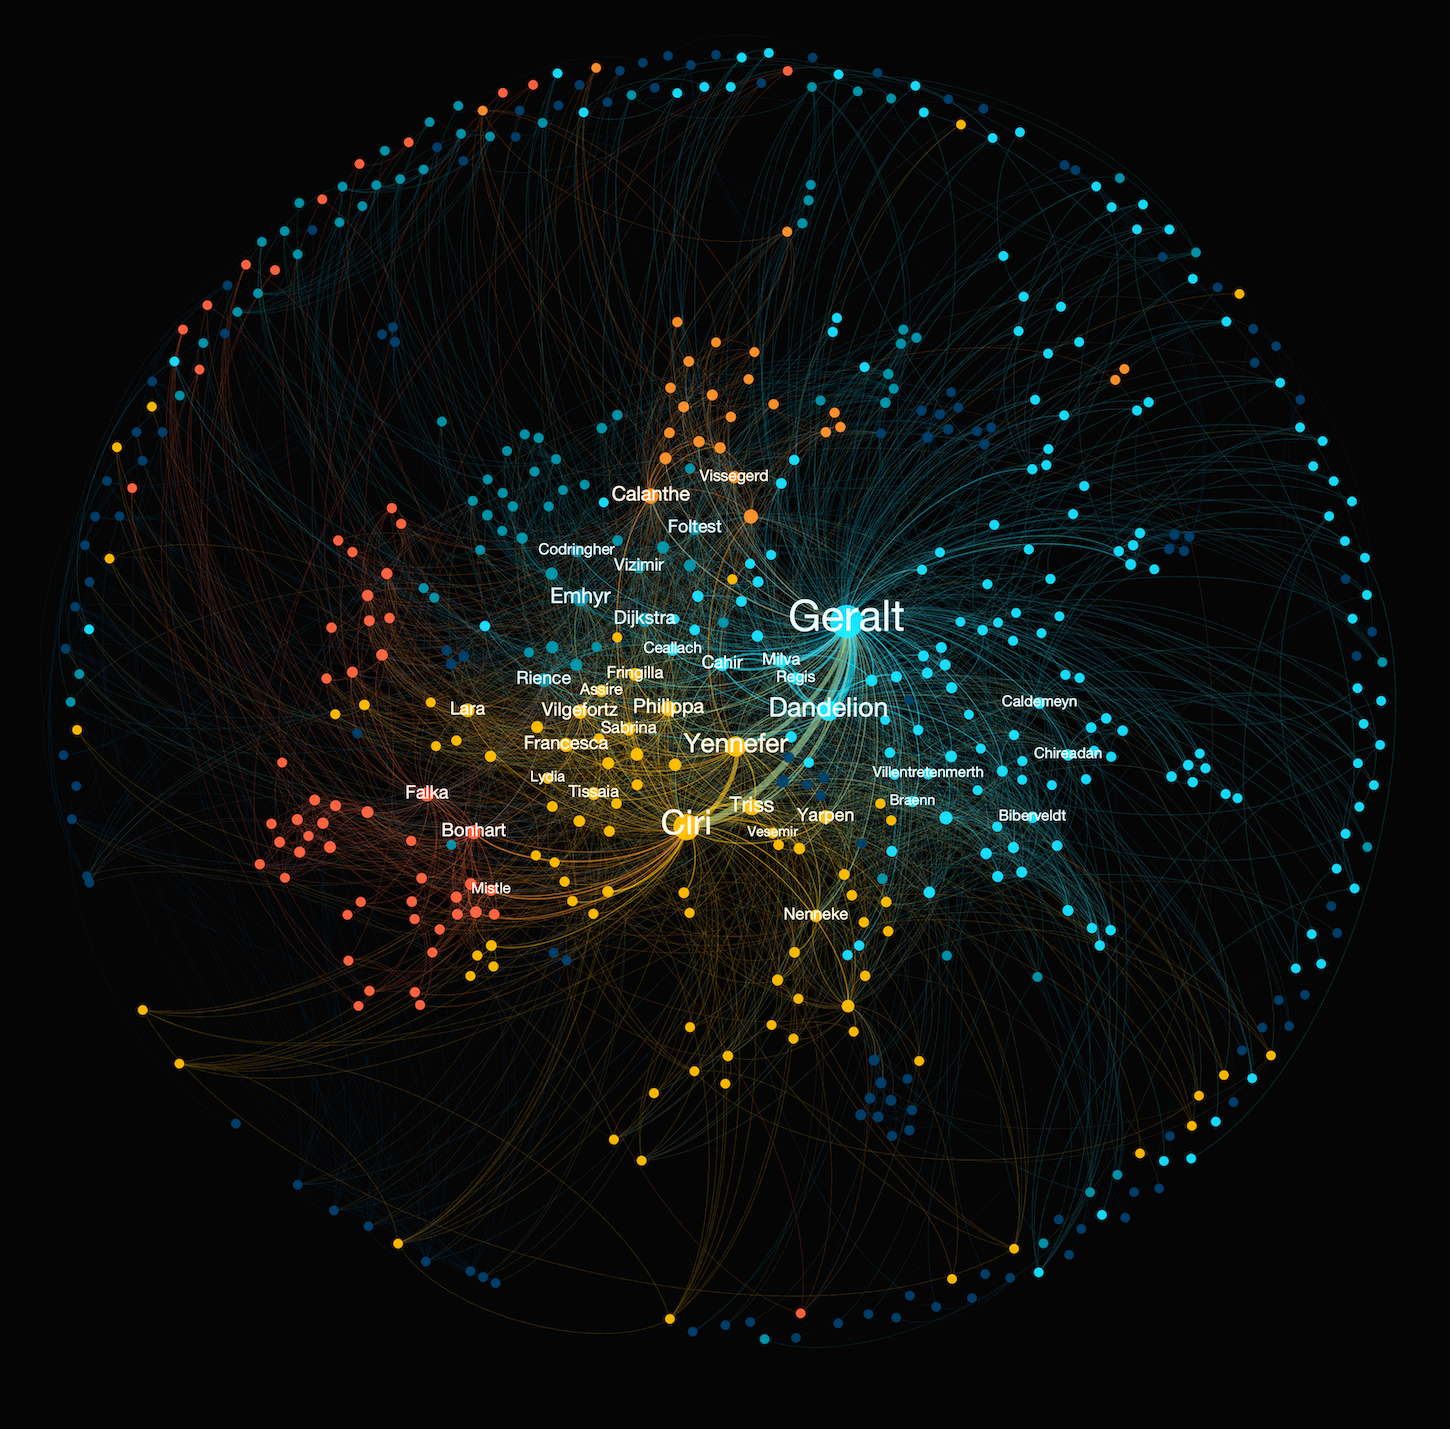
Real & synthetic networks. Generate benchmark graphs from the classic models — Erdős–Rényi, Watts–Strogatz, Barabási–Albert, plus complete, tree, and grid graphs — then read and characterize a real network (the Witcher character network) in depth, and run comparative analytics: real networks vs. random references, comparing structure and distributions.
[VISUAL: real vs. random network comparison — the Witcher network beside an Erdős–Rényi graph of the same size.]
Wrap-up & next steps. Consolidate the workflow and where to take it next, including the bridge from Python to Gephi.
WHO THIS IS FOR
You already write some Python and want to add network analysis to what you can do with data.
You're a data scientist or researcher working with relational data — collaborations, interactions, dependencies, mobility — and want to analyze it properly rather than eyeballing it.
You work in urban analytics or the social sciences where systems are naturally networks.
You've used Gephi or seen network figures and want the underlying analytical toolkit in code, so your work is reproducible and scalable.
WHAT YOU'LL LEARN
By the end of this course you can:
Build graphs of any type in NetworkX — directed, undirected, weighted — and load them from lists, spreadsheets, and GEXF files.
Draw and lay out networks clearly using different layout algorithms.
Compute and interpret the core centrality measures — degree, PageRank, betweenness, and clustering — to find hubs, bridges, and influential nodes.
Characterize a network statistically: basic properties, degree distributions, and edge-weight distributions.
Detect communities using modularity.
Generate synthetic benchmark networks from the classic models (Erdős–Rényi, Watts–Strogatz, Barabási–Albert, and more) and understand what each represents.
Run comparative analytics — measuring a real network against random references to tell real structure from noise.
Bridge your Python workflow into Gephi for visual exploration.
COURSE STRUCTURE
Module 1 — Your First Graphs in NetworkX
A refresher, then graph creation, drawing, the four graph types (directed/undirected × weighted/unweighted), and loading networks from data.
Module 2 — The Analytics Toolkit
Layouts, centralities (degree, PageRank, betweenness, clustering), network statistics and distributions, modularity/community detection, and network visualization in Python.
Module 3 — Real & Synthetic Networks
Generate synthetic benchmarks (Erdős–Rényi, Watts–Strogatz, Barabási–Albert, complete/tree/grid), analyze the Witcher network in depth, and run comparative null-model analytics — real vs. random.
Module 4 — Wrap-Up & Next Steps
Consolidating the workflow and where to go next, including the Python-to-Gephi bridge.
WHAT'S INCLUDED
🎬 ~3 hours of video lectures on the New Science of Maps platform
📓 Jupyter notebooks for every module
🕸️ Ready-to-use datasets, including the Witcher character network
♾️ Lifetime access, including future updates
PREREQUISITES / WHO IT'S NOT FOR
Prerequisites: basic Python comfort (variables, loops, running notebooks). No network science background needed — concepts are built as you code them.
Recommended companions: for the visual, Gephi-based side of network work, Network Science & Visualization is the counterpart — the two are available together as a bundle. If you work with cities and spatial data, this pairs naturally with Urban Analytics with Python: Advanced Methods, where networks power accessibility analysis. And to read more network stories, my book, Connecting the Dots is for you.
Not for you if: you've never written Python, or you want a pure no-code Gephi course (see the counterpart above).
INSTRUCTOR
Taught by Milan Janosov — network scientist and geospatial data scientist (PhD). You build alongside a working scientist, on real data, with the practical judgment that turns a raw graph into something worth looking at.