Urban Analytics with Python - An Introduction:
Spatial Data, OpenStreetMap, and the Basics of Urban Analytics
Spatial Data, OpenStreetMap, and the Basics of Urban Analytics
Everything in a city comes down to one question: where. Where do people gather, what sits in a neighborhood, how does the street network hold it all together. This course teaches you to answer those questions with data — acquiring, analyzing, and visualizing the building, road, and amenity layers that make up a city, entirely in Python, entirely from free OpenStreetMap data. You build a complete pipeline from your first data query to a citywide livability index, and it's yours to point at any city on Earth.
WHAT THIS IS
A hands-on, build-alongside introduction to urban analytics. Rather than downloading a finished dataset, you learn to acquire everything yourself from OpenStreetMap — admin boundaries, points of interest, buildings, and road networks — then analyze and visualize each layer, combine them into a reusable urban profile, and finally scale the whole thing to an entire city. Every lecture is built line by line, so you don't just run finished code; you see how each result is constructed. Vienna is the running case study, but the pipeline is written to transfer to any geography.
WHAT YOU'LL BUILD
Six chapters that take you from an empty environment to a citywide model.
A working geospatial environment and study-area pattern. Set up the open Python stack and learn to pull any city's boundaries with a single command — or fall back to a bounding box when a place name won't resolve.
A data-acquisition toolkit for OpenStreetMap. Query administrative areas, points of interest, and polygon features, then crop and clean them so your pipeline won't break on messy data.
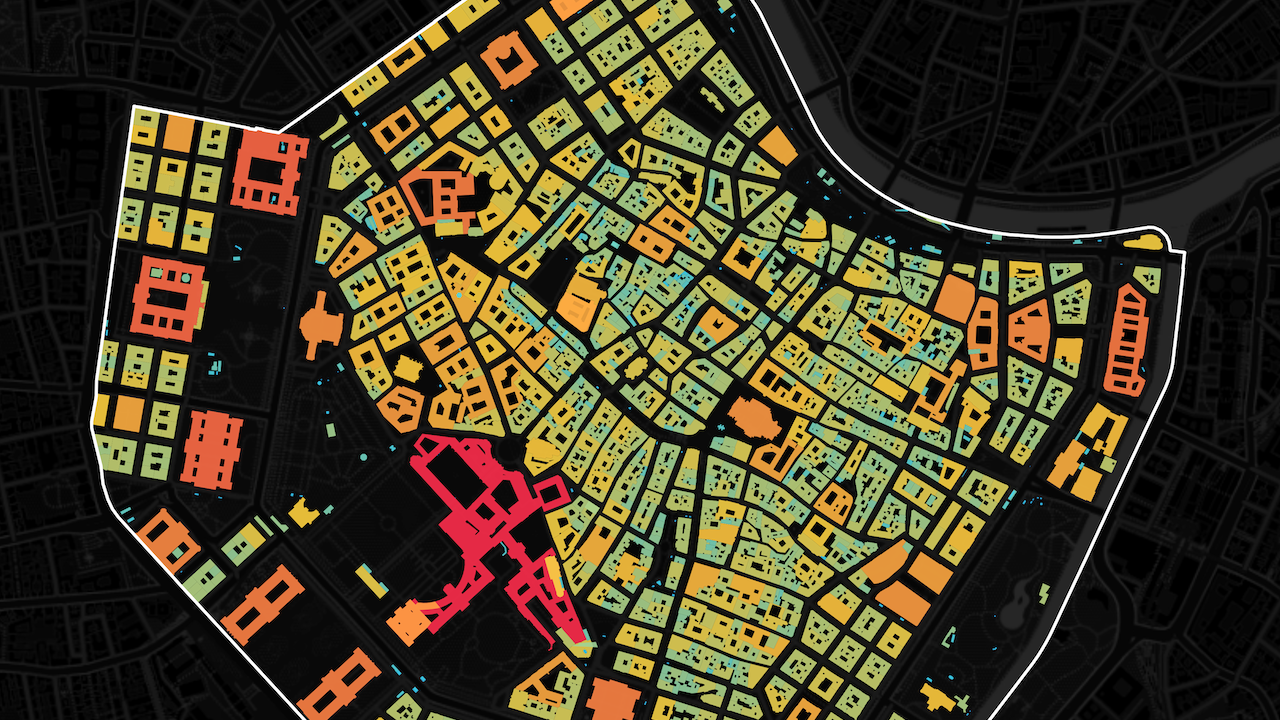
Building analysis from footprints. Explore OSM's densest layer — building footprints — and map them by function (amenity), then by continuous attributes like footprint area, height, and number of floors.
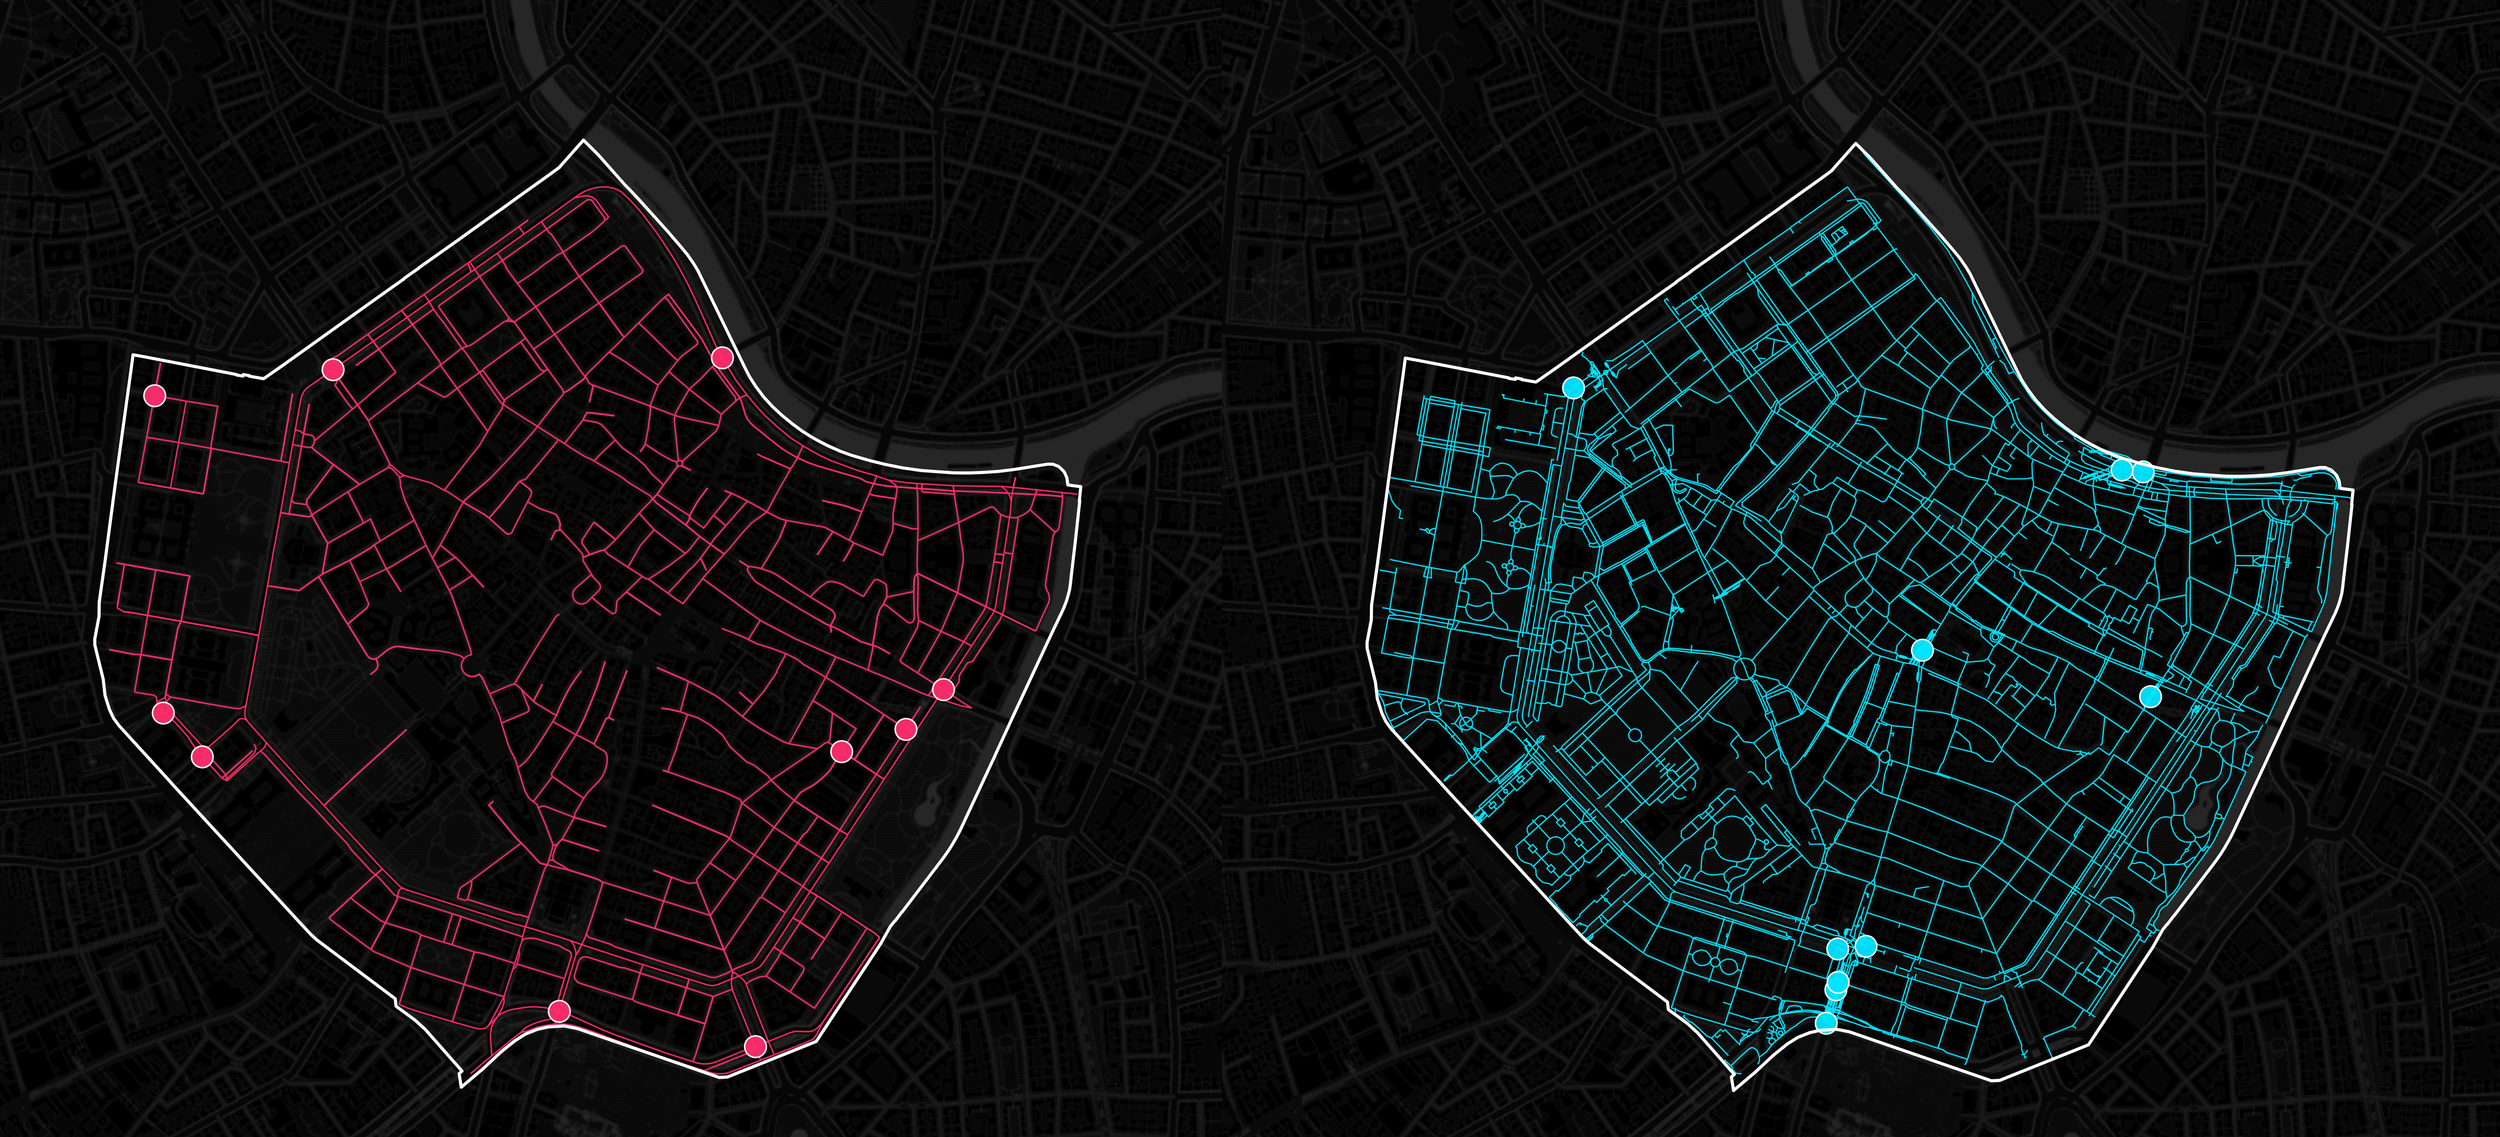
Road network analysis. Acquire drivable and walkable networks as graph objects, turn them into GeoDataFrames, compute network statistics and hubs, and map road types weighted by importance.
A reusable urban profile. Add base maps with contextily and compose every layer — boundaries, buildings, parks, roads, and all POI categories — into one clean, reusable profiling function.
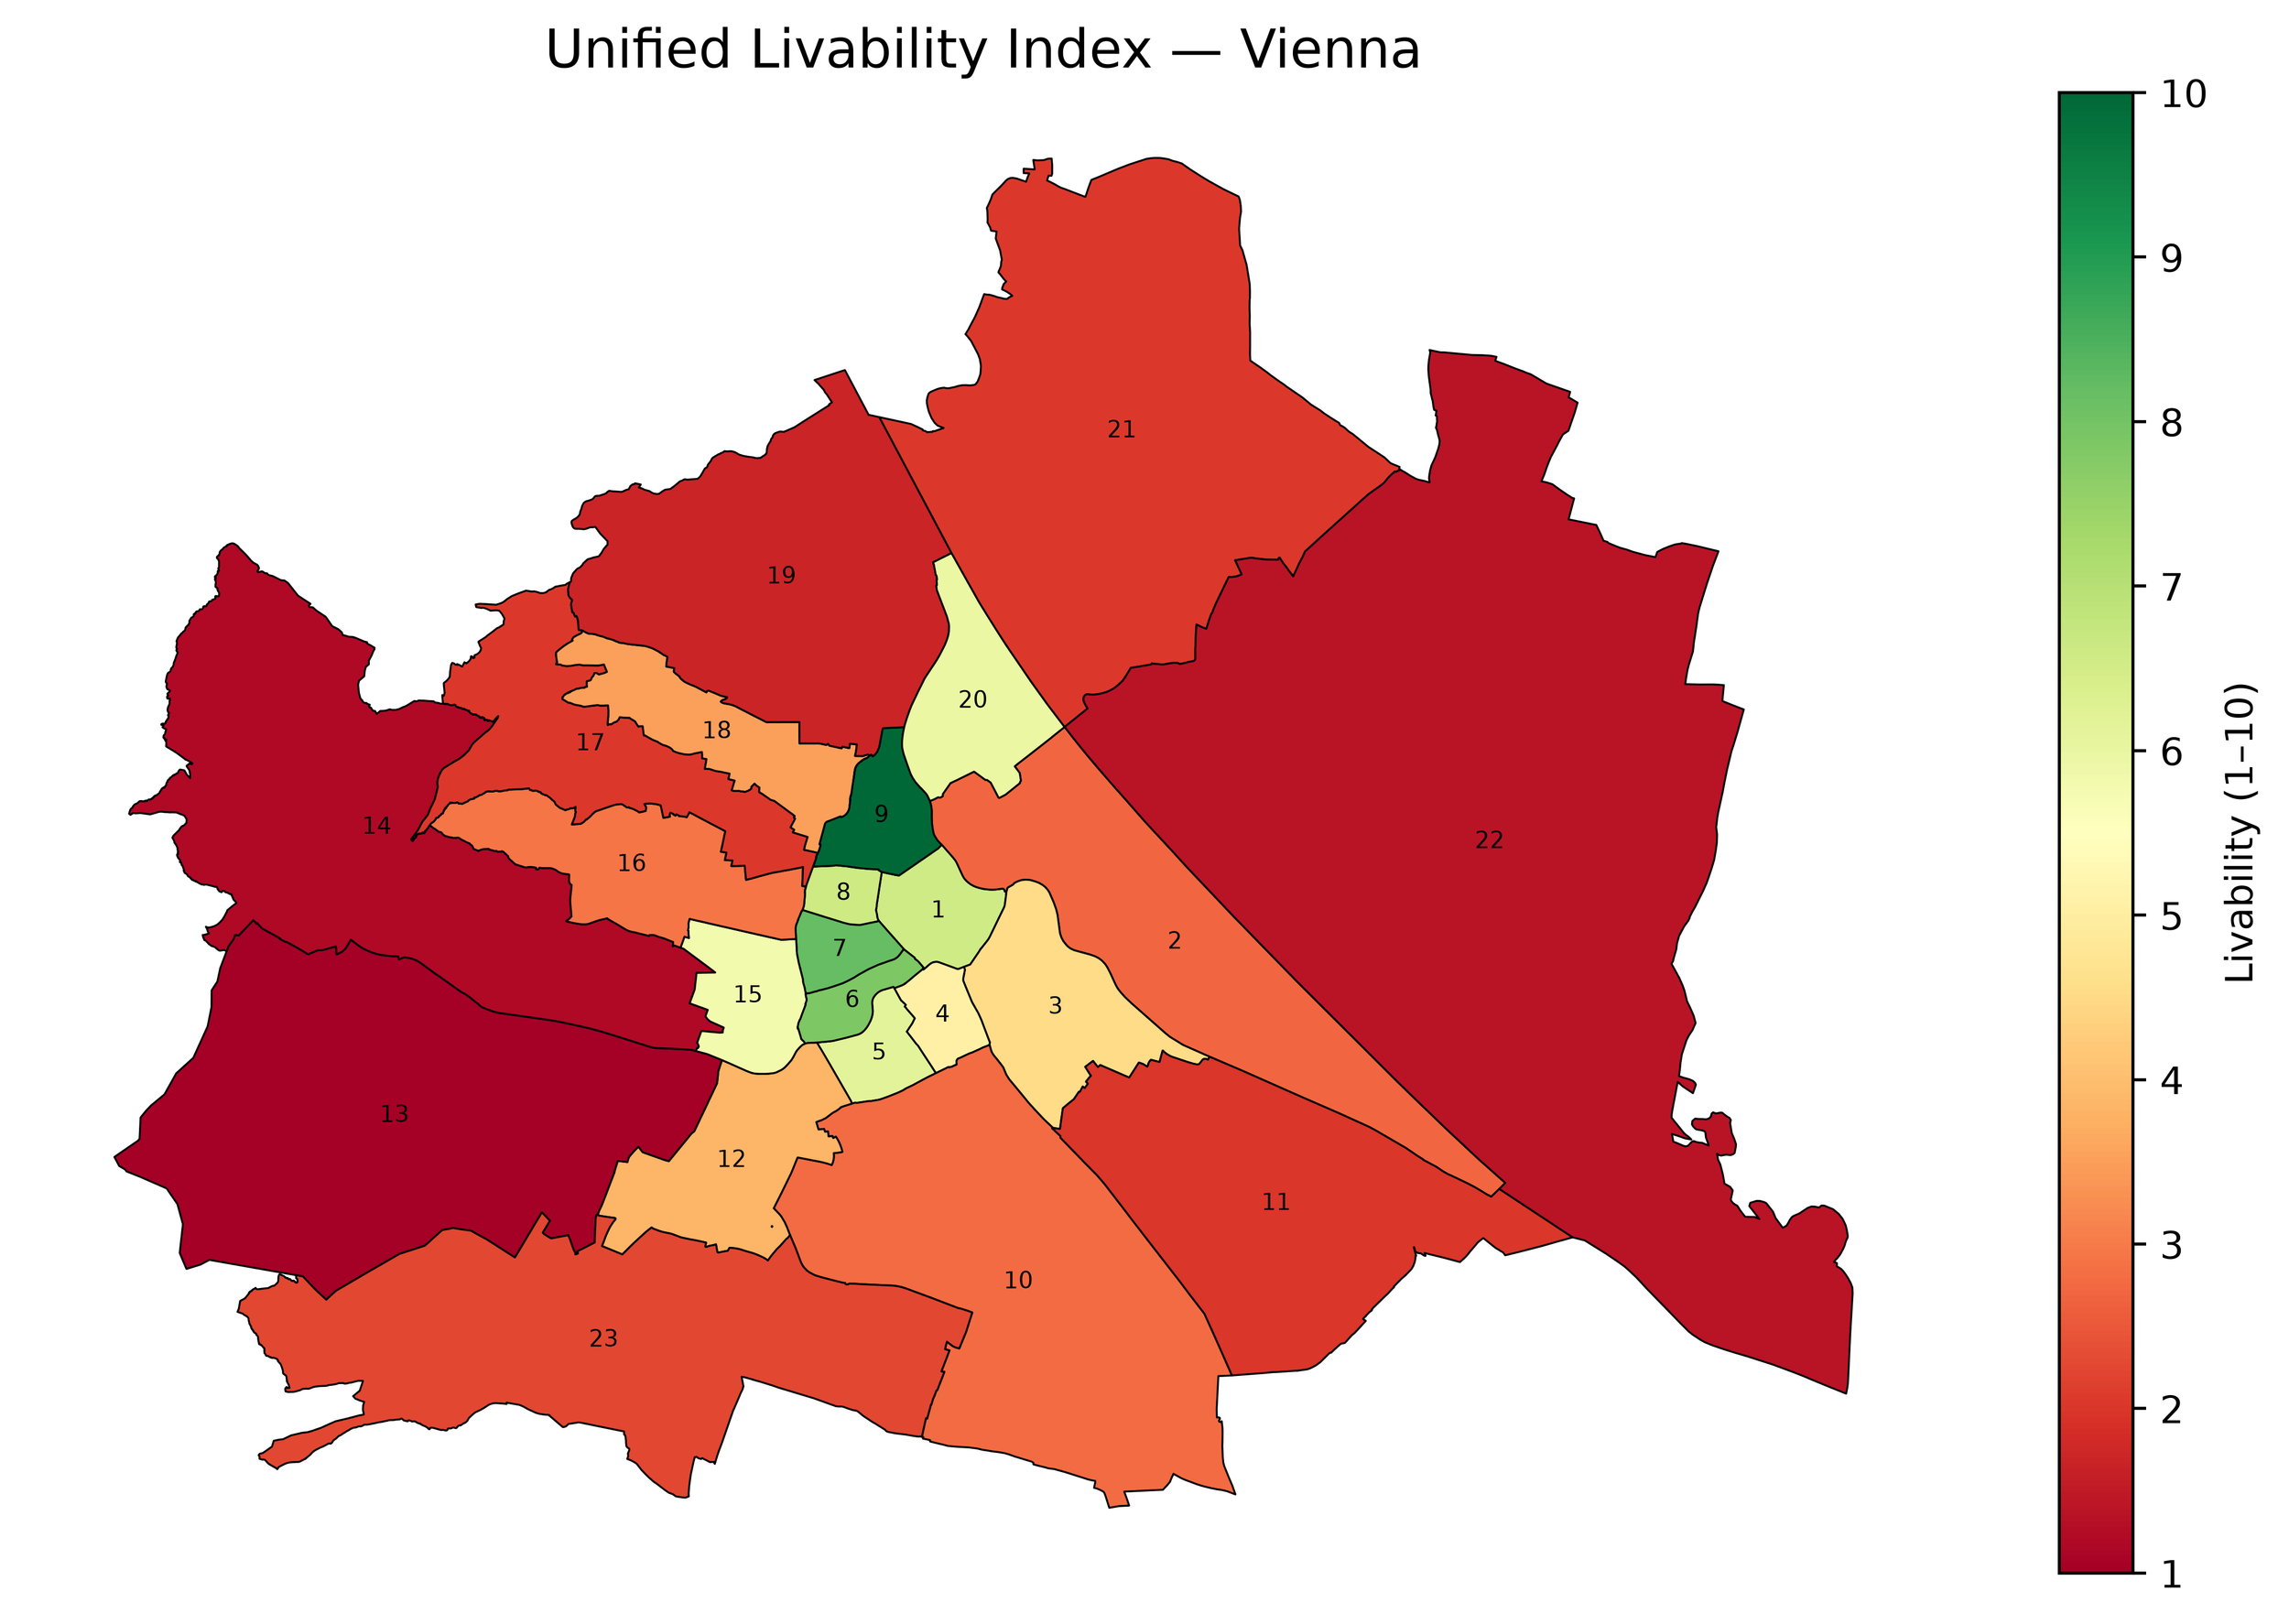
A citywide livability index. Scale the pipeline across all 23 districts of Vienna, derive numeric KPIs for each, and combine them into a single adjustable 1–10 livability score, mapped across the city.
WHO THIS IS FOR
You work in urban planning, real estate, or the public sector and want to produce your own maps and city analyses rather than commissioning them.
You're a data scientist or analyst moving into spatial problems and want a clean, reproducible way into the geospatial stack.
You're a researcher or student who needs a working, from-scratch urban pipeline you fully understand and can adapt to your own study area.
You already use some Python and want to add cities, maps, and OpenStreetMap to what you can do with data.
You learn by building — you'd rather construct a livability index line by line than read about one.
WHAT YOU'LL LEARN
By the end of this course you can:
Explain what geospatial data is — vector vs. raster — and why cities are inherently spatial problems that spreadsheets flatten.
Acquire any city's data from OpenStreetMap in Python: admin boundaries, points of interest, buildings, and road networks, by place name or bounding box.
Handle real-world data messiness — unresolved place names, missing-value coverage, contaminated geometries — so your pipeline stays robust.
Map buildings by both categorical function and continuous attributes (area, height, floors), with proper metric units and readable legends.
Analyze road networks as graphs: convert them to GeoDataFrames, compute statistics, identify hubs, and classify road types.
Add base maps and compose multi-layer urban visualizations into a single reusable profiling function.
Scale a single-district workflow to an entire city, derive per-district KPIs, and combine them into an adjustable livability index — understanding exactly how subjective such an index is.
Take the whole pipeline and point it at any city on Earth.
COURSE STRUCTURE
1. Setting up — OpenStreetMap as a data source, the Python environment, and the study-area pattern for querying any location.
2. Acquiring Urban Data from OSM — Administrative boundaries, points of interest, and polygon-level features, with cropping and cleaning.
3. Buildings on OSM — Screening well-populated tags, then categorical (function) and continuous (area, height, floors) building maps.
4. Road Networks — Drivable vs. walkable networks, graph-to-GeoDataFrame conversion, network statistics and hubs, and road types.
5. Urban Profile — Base maps with contextily and every layer composed into one reusable urban profile.
6. Simple Livability Index — Scaling citywide, deriving per-district KPIs, and building an adjustable 1–10 livability index for all of Vienna.
WHAT'S INCLUDED
🎬 ~2.5 hours of video lectures on the New Science of Maps platform
📓 Two versions of every Jupyter notebook — a commented standalone version and the exact recorded version
🛰️ OpenStreetMap-based datasets and the full reusable pipeline
🐍 The open Python geospatial stack: OSMnx, GeoPandas, contextily, Matplotlib
♾️ Lifetime access, including future updates
PREREQUISITES / WHO IT'S NOT FOR
Prerequisites: basic Python comfort (variables, loops, running notebooks). No prior urban analytics or GIS background needed — core geospatial concepts are introduced from first principles in Chapter 1.
Recommended companions: for a broader reference on the geospatial Python stack, the book Geospatial Data Science Essentials: 101 Practical Python Tips and Tricks pairs well with this course. Ready for spatial modeling next? Continue with Urban Analytics with Python: Advanced Methods.
Not for you if: you've never written Python, or you want a no-code GIS tool. This course focuses on vector data from OpenStreetMap — for satellite/raster deep learning, Fundamentals of GeoAI is the better fit.
INSTRUCTOR
Taught by Milan Janosov — geospatial data scientist and network scientist (PhD). You build alongside a working scientist, on real data, with honest attention to what each method can and can't tell you.