How to Think Spatially:
A Conceptual Introduction to Geospatial Data Science
A Conceptual Introduction to Geospatial Data Science
Understand how spatial data actually works — the concepts, the traps, the vocabulary — before you write a single line of code.
Most people meet geospatial the hard way: a tutorial, a library, an error message about coordinate systems, and no idea why any of it behaves the way it does. This course flips that order. It gives you the conceptual foundation first — what makes data spatial, why nearby things break normal statistics, how the world gets flattened onto a screen, and where the traps are — so that every tutorial you open afterwards makes sense.
WHAT THIS IS
A no-code introduction to spatial data science. Slides, visuals, and theory — no Python, no software to install, no setup. It's roughly an hour, in five chapters, and it's deliberately concept-first: you finish holding the ideas that every line of geospatial code is expressing. Throughout, each concept points to the exact chapter and step in my Geospatial Data Science Essentials book where you can build it in code — so the moment you want to go hands-on, you know precisely where to go.
WHAT YOU'LL UNDERSTAND
Five chapters that take you from "what even is spatial data" to the traps that catch professionals.
Orientation — why spatial data is special. How a normal table becomes spatial data, the anatomy of a spatial record (attributes, geometry, coordinate frame), Tobler's Law and spatial autocorrelation, where spatial data science sits between GIS and data science — and John Snow's 1854 cholera map, the founding story of the field.
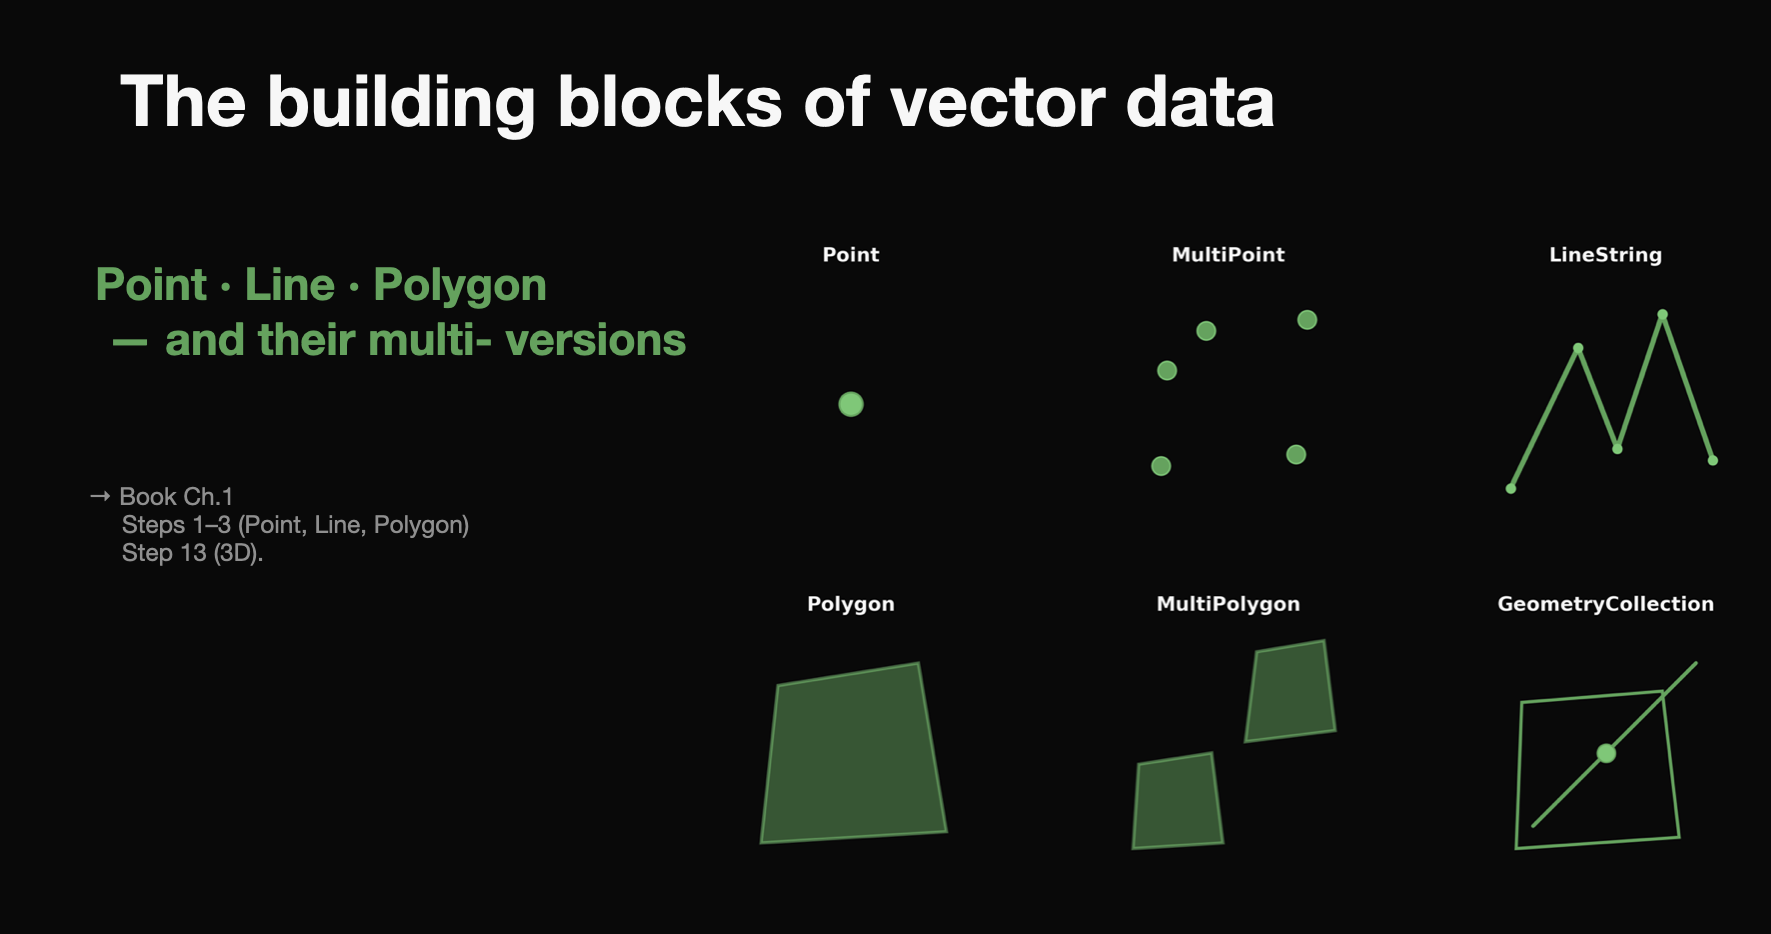
Representation — vector and raster. The two data models and what each is for, the full geometry vocabulary (points, lines, polygons and their multi- versions), raster cells, bands, extent and resolution, the file formats you'll actually meet (GeoJSON, GeoPackage, GeoParquet, GeoTIFF), and why projections distort — including why you cannot measure distance in latitude and longitude, and what EPSG codes are for.
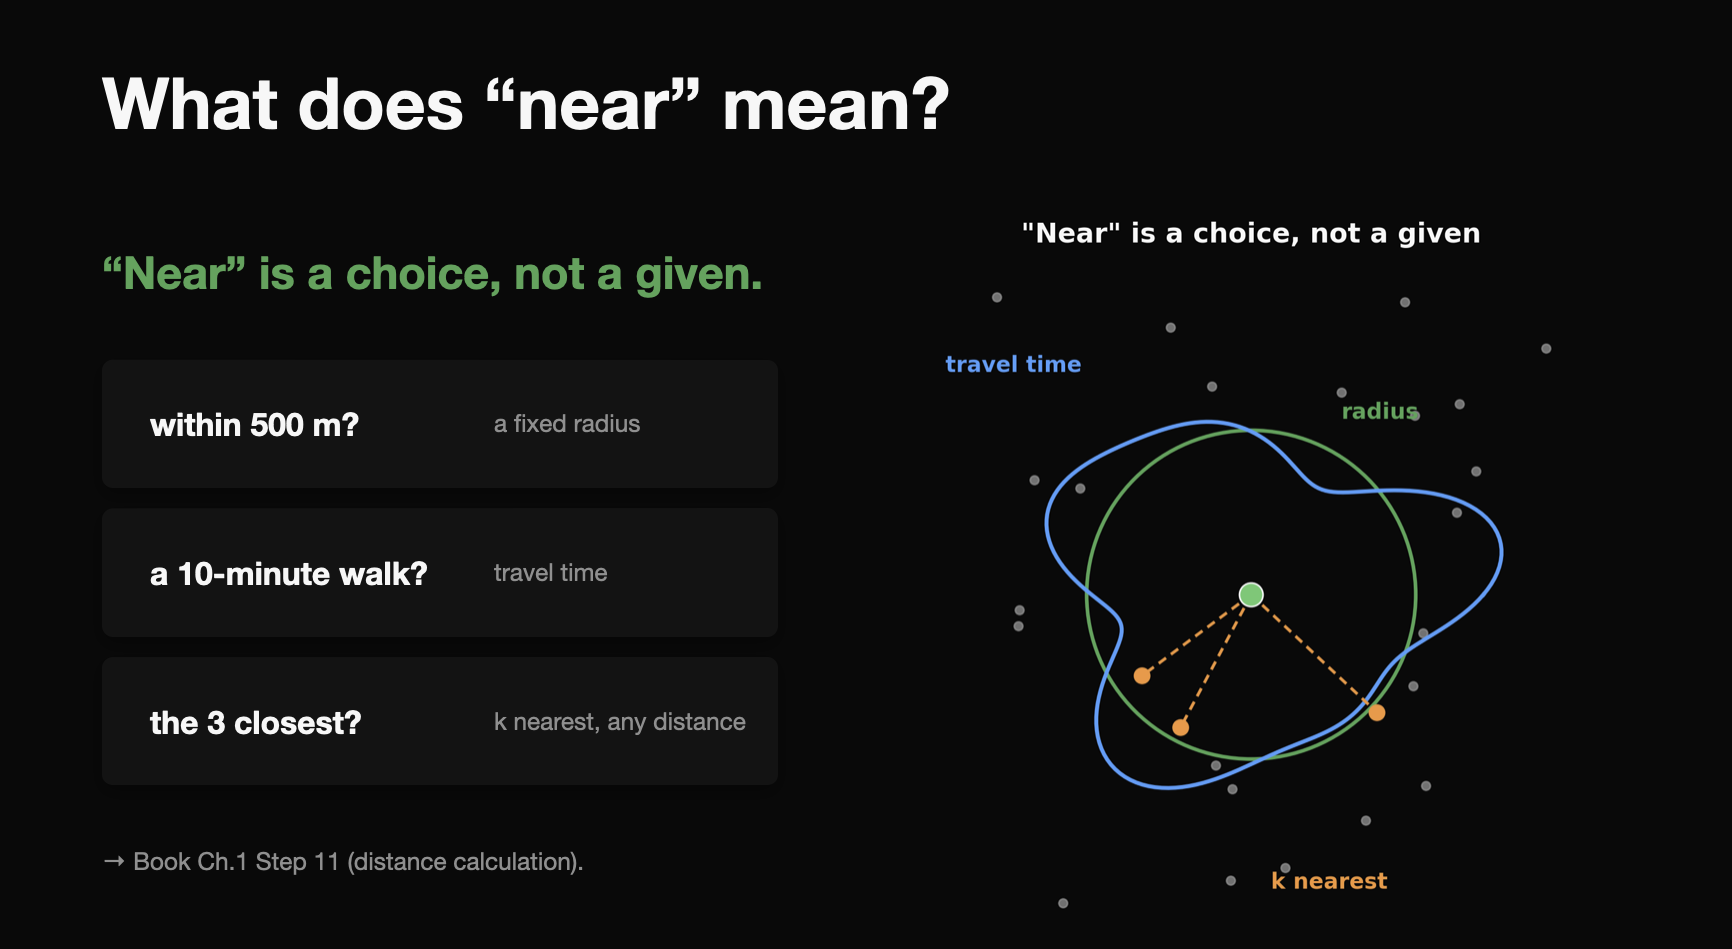
Measuring space. What "near" actually means — radius, walking time, or nearest — and why those three disagree. Street network structure (grid, organic, radial), isochrones and accessibility, the 15-minute city, and spatial aggregation from hexagons to neighbourhoods to whole cities.
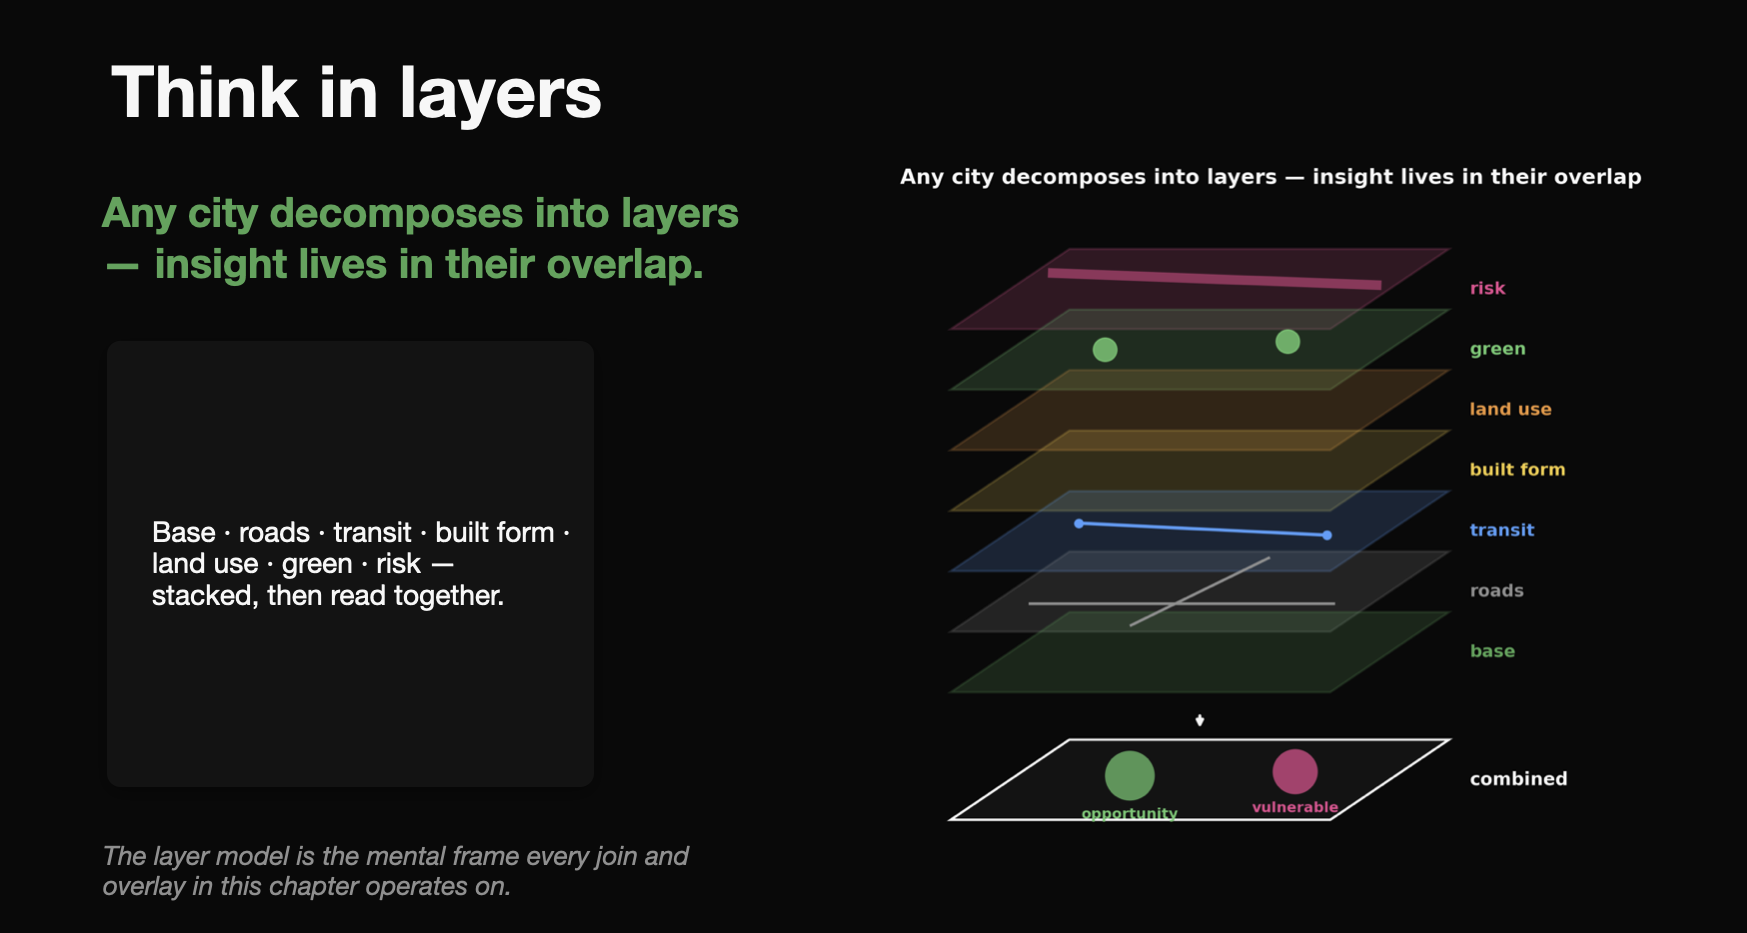
Relating and reading space. Thinking in layers, spatial joins (matching by location rather than by key), overlay operations and what they're for, Ian McHarg's 1969 acetate-sheet suitability analysis, Moran's I and hotspots — and the four map types you'll meet constantly: choropleth, log-scaled, categorical, and heat maps.
From maps to models. Description versus prediction, why spatial machine learning is different, the data leakage trap that makes random train/test splits lie on spatial data, what GeoAI adds and where it stops, the geospatial workflow end to end, and the three ways every spatial dataset is a little bit wrong.
WHO THIS IS FOR
You're new to geospatial and want the concepts before the code.
You work next to a geospatial team — as a product manager, analyst, or executive — and need to follow the conversation, judge the outputs, and ask the right questions.
You're a data scientist moving into spatial work, and want to know upfront why your usual assumptions break here.
You come from an adjacent field — urban planning, architecture, geology, civil engineering, ecology — where spatial data is already part of the work.
You already do GIS or spatial analysis and want a structured overview of the concepts, framed from a data science angle.
WHAT YOU'LL LEARN
By the end of this course you can:
Explain what makes data spatial, and name the three parts of a spatial data record.
State Tobler's Law and explain why spatial autocorrelation breaks the independence assumption behind most classical statistics.
Choose between vector and raster for a given question, and recognise the common file formats on sight.
Explain what a coordinate reference system does, why latitude and longitude can't measure distance, and what an EPSG code is.
Distinguish radius-based proximity from network-based accessibility, and read an isochrone.
Understand spatial aggregation and how the choice of spatial unit shapes what you'll see.
Read a spatial join, an overlay, and a suitability analysis, and know what each is for.
Interpret Moran's I and hotspots, and read choropleth, log-scaled, categorical, and heat maps critically.
Recognise the spatial data leakage trap — and why a random train/test split flatters a spatial model.
Follow the full geospatial workflow, and name the three error types every spatial dataset carries.
COURSE STRUCTURE
Chapter 1 — Orientation: Why Spatial Data Is Special
Tabular data versus spatial data, the anatomy of a spatial record, Tobler's Law, geospatial data science between GIS and data science, and John Snow's cholera map.
Chapter 2 — How Spatial Data Is Represented
Vector and raster models, geometry building blocks, raster cells and bands, file formats, the 3D-to-2D problem, projections and distortion, CRS and EPSG codes.
Chapter 3 — Measuring Space
Defining "near," the CRS distance trap, radius versus network accessibility, isochrones, urban network structures, the 15-minute city, and spatial aggregation.
Chapter 4 — Relating and Reading Space
Spatial layers, spatial joins, overlays and set operations, McHarg's suitability analysis, Moran's I and hotspots, and four essential map types.
Chapter 5 — From Maps to Models
Description to prediction, spatial machine learning, the leakage trap and spatial holdouts, GeoAI, the geospatial workflow, and spatial data errors.
WHAT'S INCLUDED
🎬 ~1 hour of video lectures on the New Science of Maps platform
🗺️ Concept-first slides and custom visualizations throughout
📖 Direct pointers into Geospatial Data Science Essentials for every concept
♾️ Lifetime access, including future updates
PREREQUISITES / WHO IT'S NOT FOR
Prerequisites: none. No Python, no GIS software, no maths background. If you can read a map, you can take this course.
Recommended next steps: this is the front door to the library. From here, Geospatial Data Science Essentials turns every concept into runnable Python; Urban Analytics with Python applies it to cities; the satellite courses cover raster and imagery in depth; and the GeoAI course picks up where Chapter 5 leaves off. If networks caught your interest in Chapter 3, Network Analytics & Visualization in Python is the counterpart.
Not for you if: you want hands-on coding — this course deliberately has none, and the book is where that lives. If you're already an experienced spatial data scientist, expect a structured overview and framing rather than new techniques.
INSTRUCTOR
Taught by Milan Janosov — network scientist and geospatial data scientist (PhD). The concepts come from years of applied work, so what you get is the practical framing that makes the rest of the field readable.