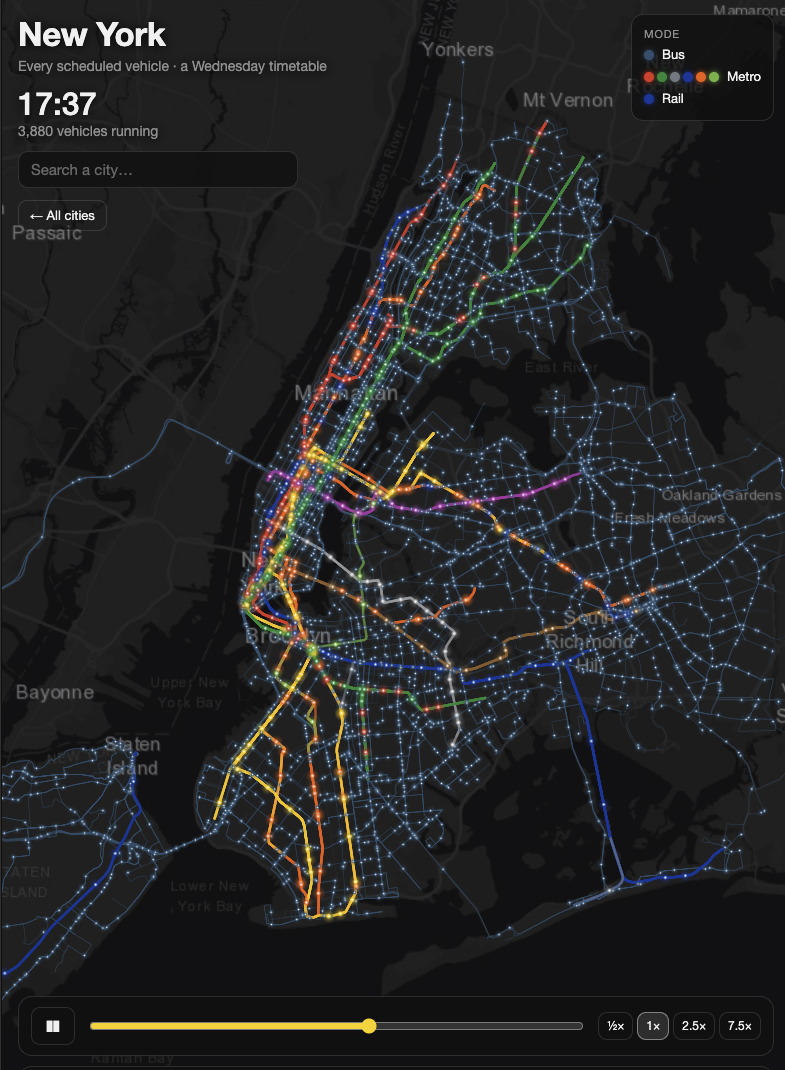
My transit reels became an interactive map. Pick a city, drag the clock, watch it breathe.
Over the past few weeks, my transit animations have traveled further than anything I’ve posted before: every scheduled bus, tram, metro, and train in a city, moving through twenty minutes of a weekday morning. Budapest, Vienna, New York, Barcelona and many more.
The most common question in the comments was some version of “can I see my city?” or “what does it look like at midnight?”
And now, besdes the 10-sec animations, you can - and play around with it in an interactive way: Transit Pulse: the interactive map
What you can do:
Pick a city on the world map, or search for it.
Drag the clock through a full weekday, from the first early-morning trams to the last night buses.
Speed it up or slow it down, and zoom into your own neighborhood.
There are 12 cities so far: Amsterdam, Barcelona, Boston, Budapest, Chicago, New York, Paris, Prague, Riga, Rome, Toronto and Vienna. Paris alone runs more than 80,000 scheduled trips in a single day.
It is the same idea as the reels. Every dot is one scheduled vehicle, built from the cities’ open timetable data (GTFS), not live GPS. That is why you see the city’s plan for a normal weekday, rush hours, lunchtime lulls and the night network, all in one view.
More cities are coming. Reply and tell me which one you want to see next, and I’ll prioritise the most requested.
Have fun, and send me a screenshot of your city at its busiest minute.
For a quick Python tutorial: https://www.youtube.com/watch?v=QQ5xpZ88bA4
For a course-level deep dive: https://www.thenewscienceofmaps.com/courses/urban-advanced
Milan
