30-Day Map Challenge 2025:
Director's Cut
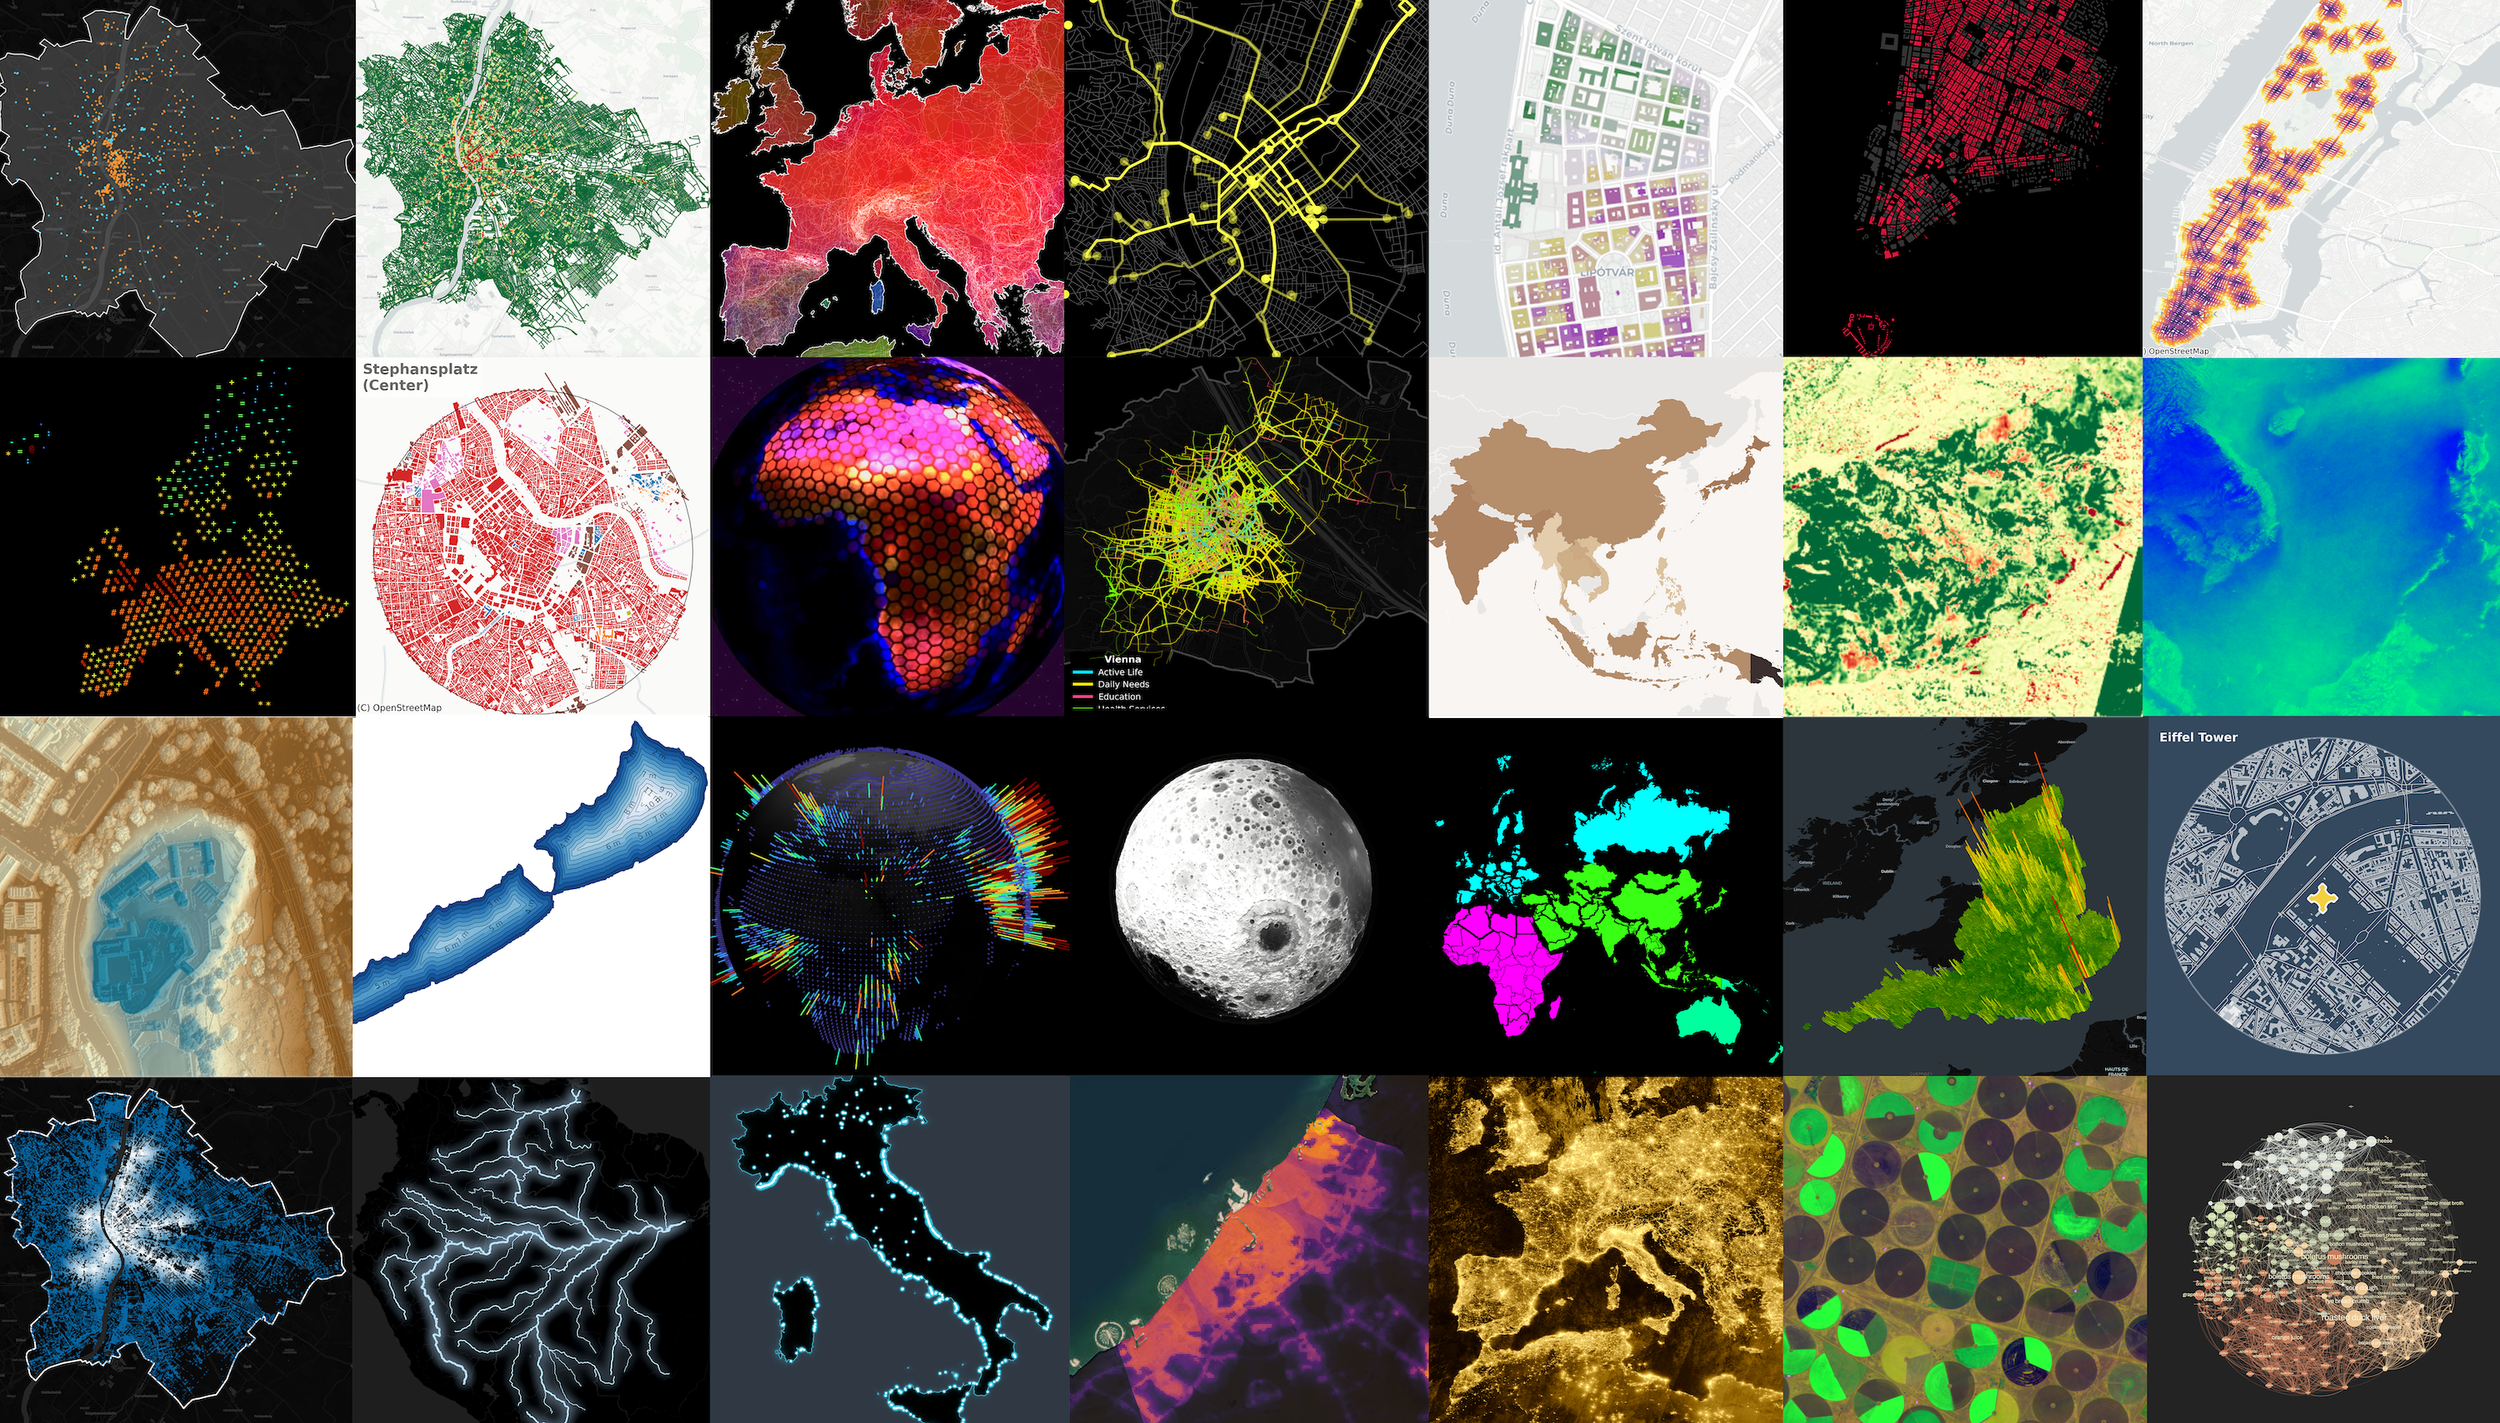
Build 30 real-world maps in Python — using open data, satellite imagery, and GeoAI.
Thirty maps, thirty days, one language. This is the full behind-the-scenes cut of the 2025 #30DayMapChallenge: every project rebuilt from scratch in Python, with the source code, the ready-to-run data, and the decisions that don't make it into a YouTube tutorial. From interactive POI maps and isochrone animations to 3D lunar terrain, wildfire detection, and river networks — you build all of it yourself.
WHAT THIS IS
Most map tutorials show you a finished result. This one shows you the whole build — planning, tooling, the data wrangling, and the aesthetic calls — across 30 genuinely different projects. It's not a theory course; it's 30 complete pipelines you run, read, and adapt. Every map comes with full source code and a ready-to-run data sample, so nothing is left as "an exercise for the reader."
You don't need prior geospatial experience. The projects are grouped into themed sections that build a real working knowledge of the Python geospatial stack — vector data, urban analytics, raster and satellite, 3D surfaces, networks, and a first taste of GeoAI.
WHAT YOU'LL BUILD
Thirty projects, organized into eight themed build-sections plus setup and a reference toolkit.
Vector foundations. Interactive POI maps over Budapest, a road-accident map across ~100,000 street segments, IUCN wildlife-habitat polygons, blue-ink landmark cutouts, and a Web-Mercator-vs-true-size country animation that shows why projection choice actually matters.
[VISUAL: Day 1 POI map or Day 21 blue-ink landmark cutouts.]
Urban analytics & accessibility. NYC subway isochrones with Pandana and GTFS, Vienna's urban fabric, a 15-minute-city walkability analysis across four European capitals, and Budapest transit accessibility from raw GTFS.
[VISUAL: Day 7 NYC isochrone animation — one of the strongest visuals in the course.]
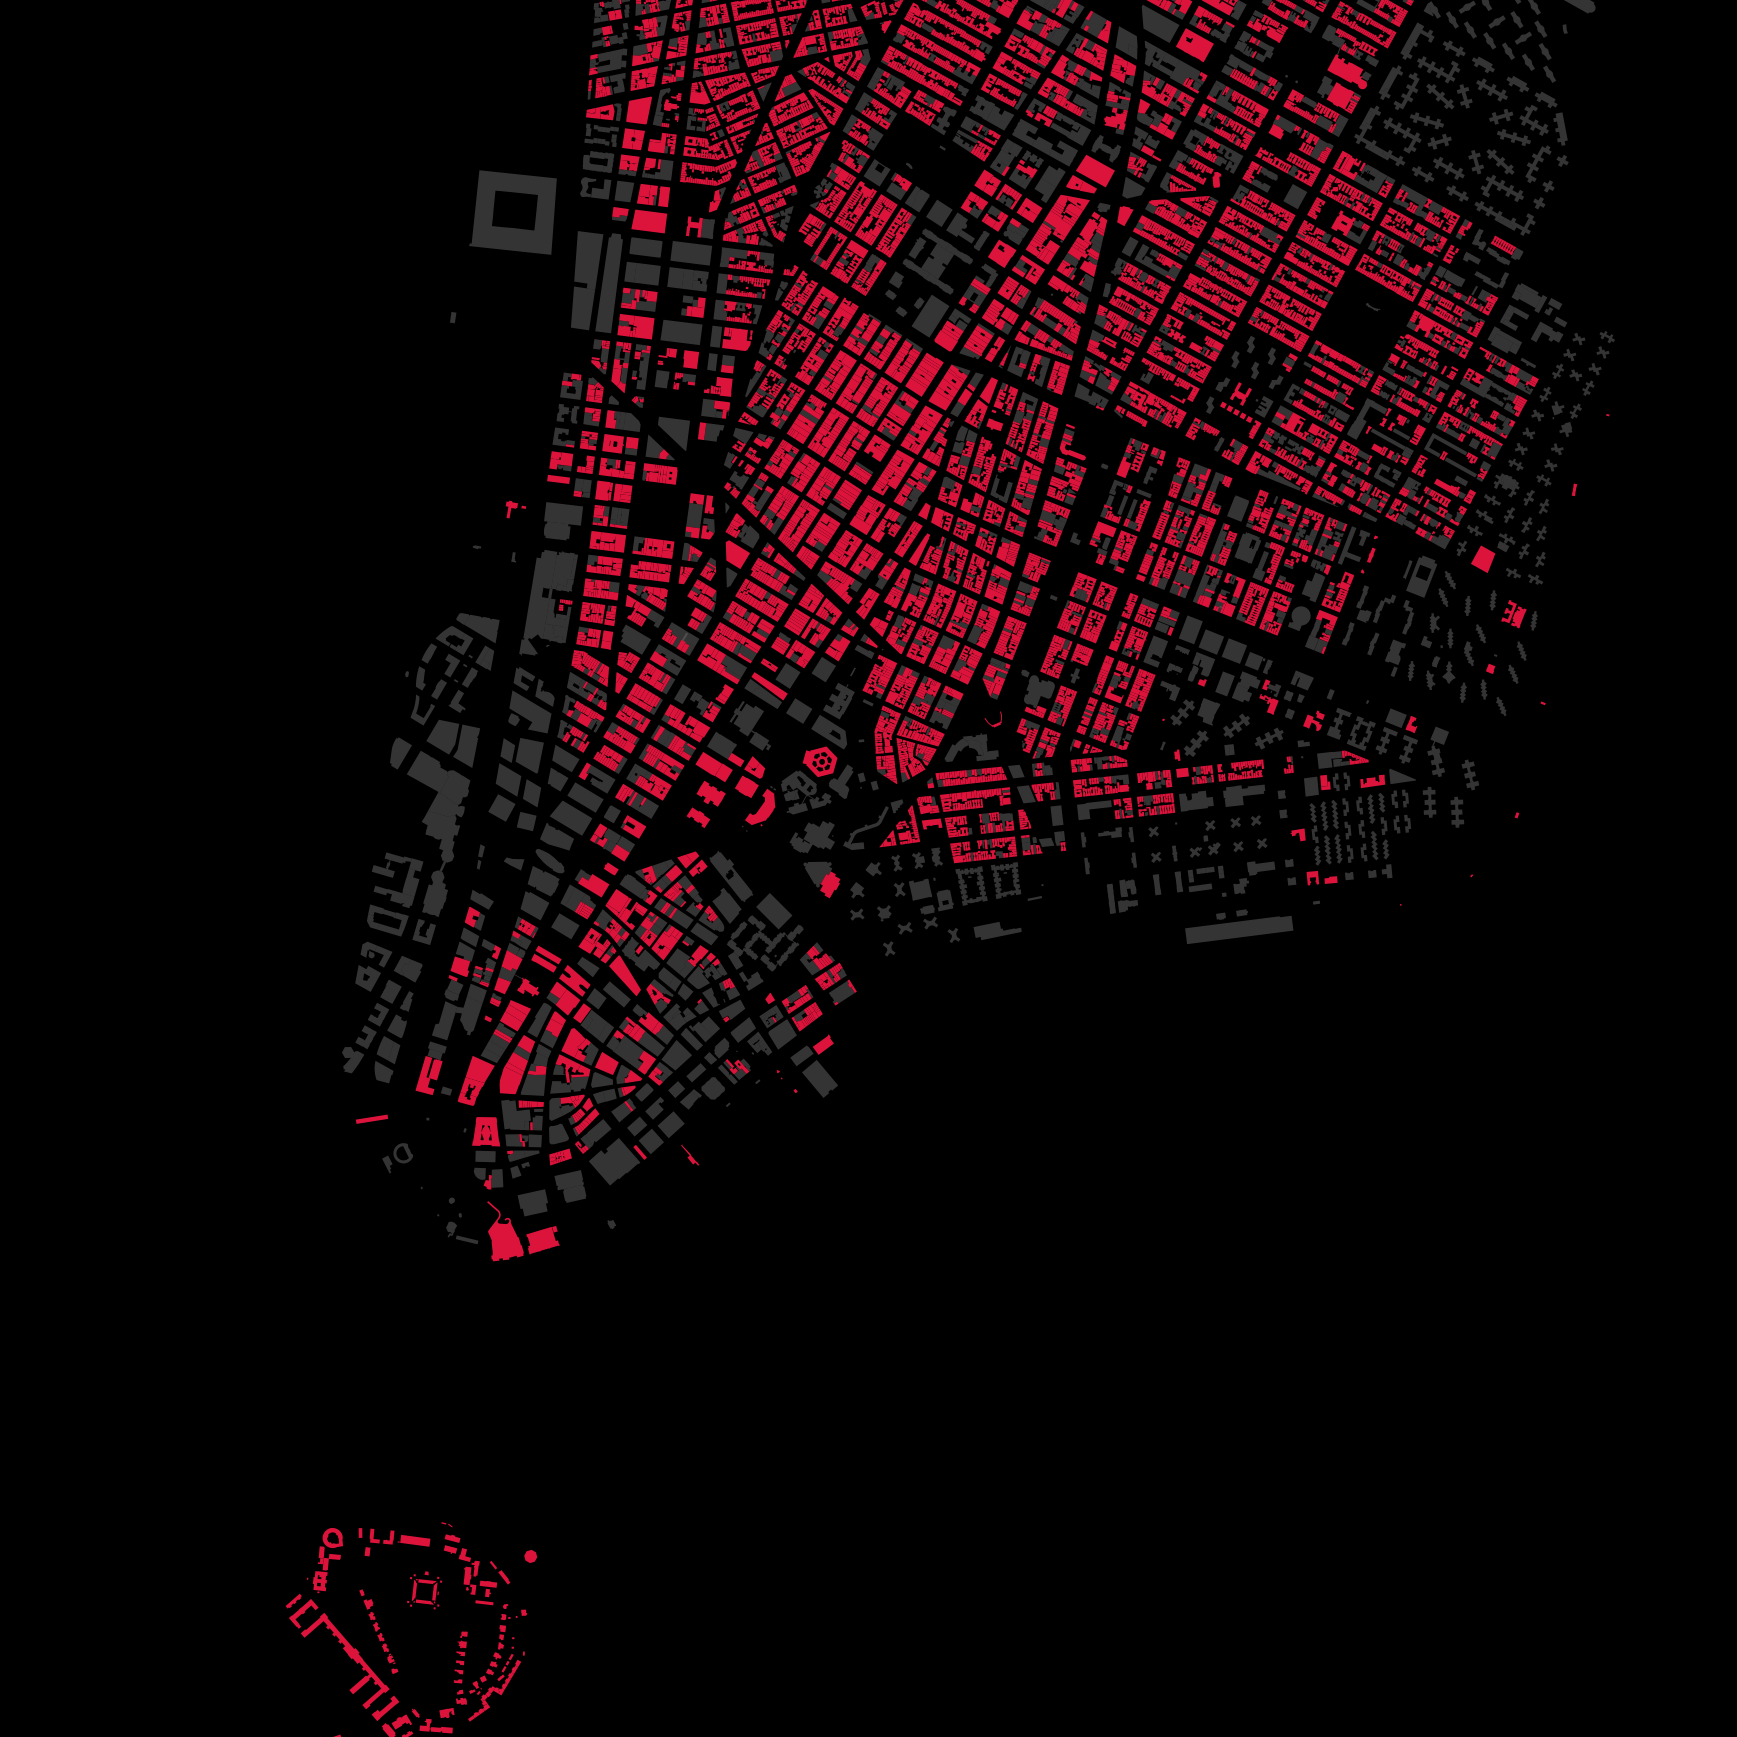
Time, change & animation. 200 years of Manhattan construction, two decades of Dubai's growth from WorldPop rasters, and a cinematic projection of world population to 2125.
[VISUAL: Day 6 Manhattan growth time-lapse.]
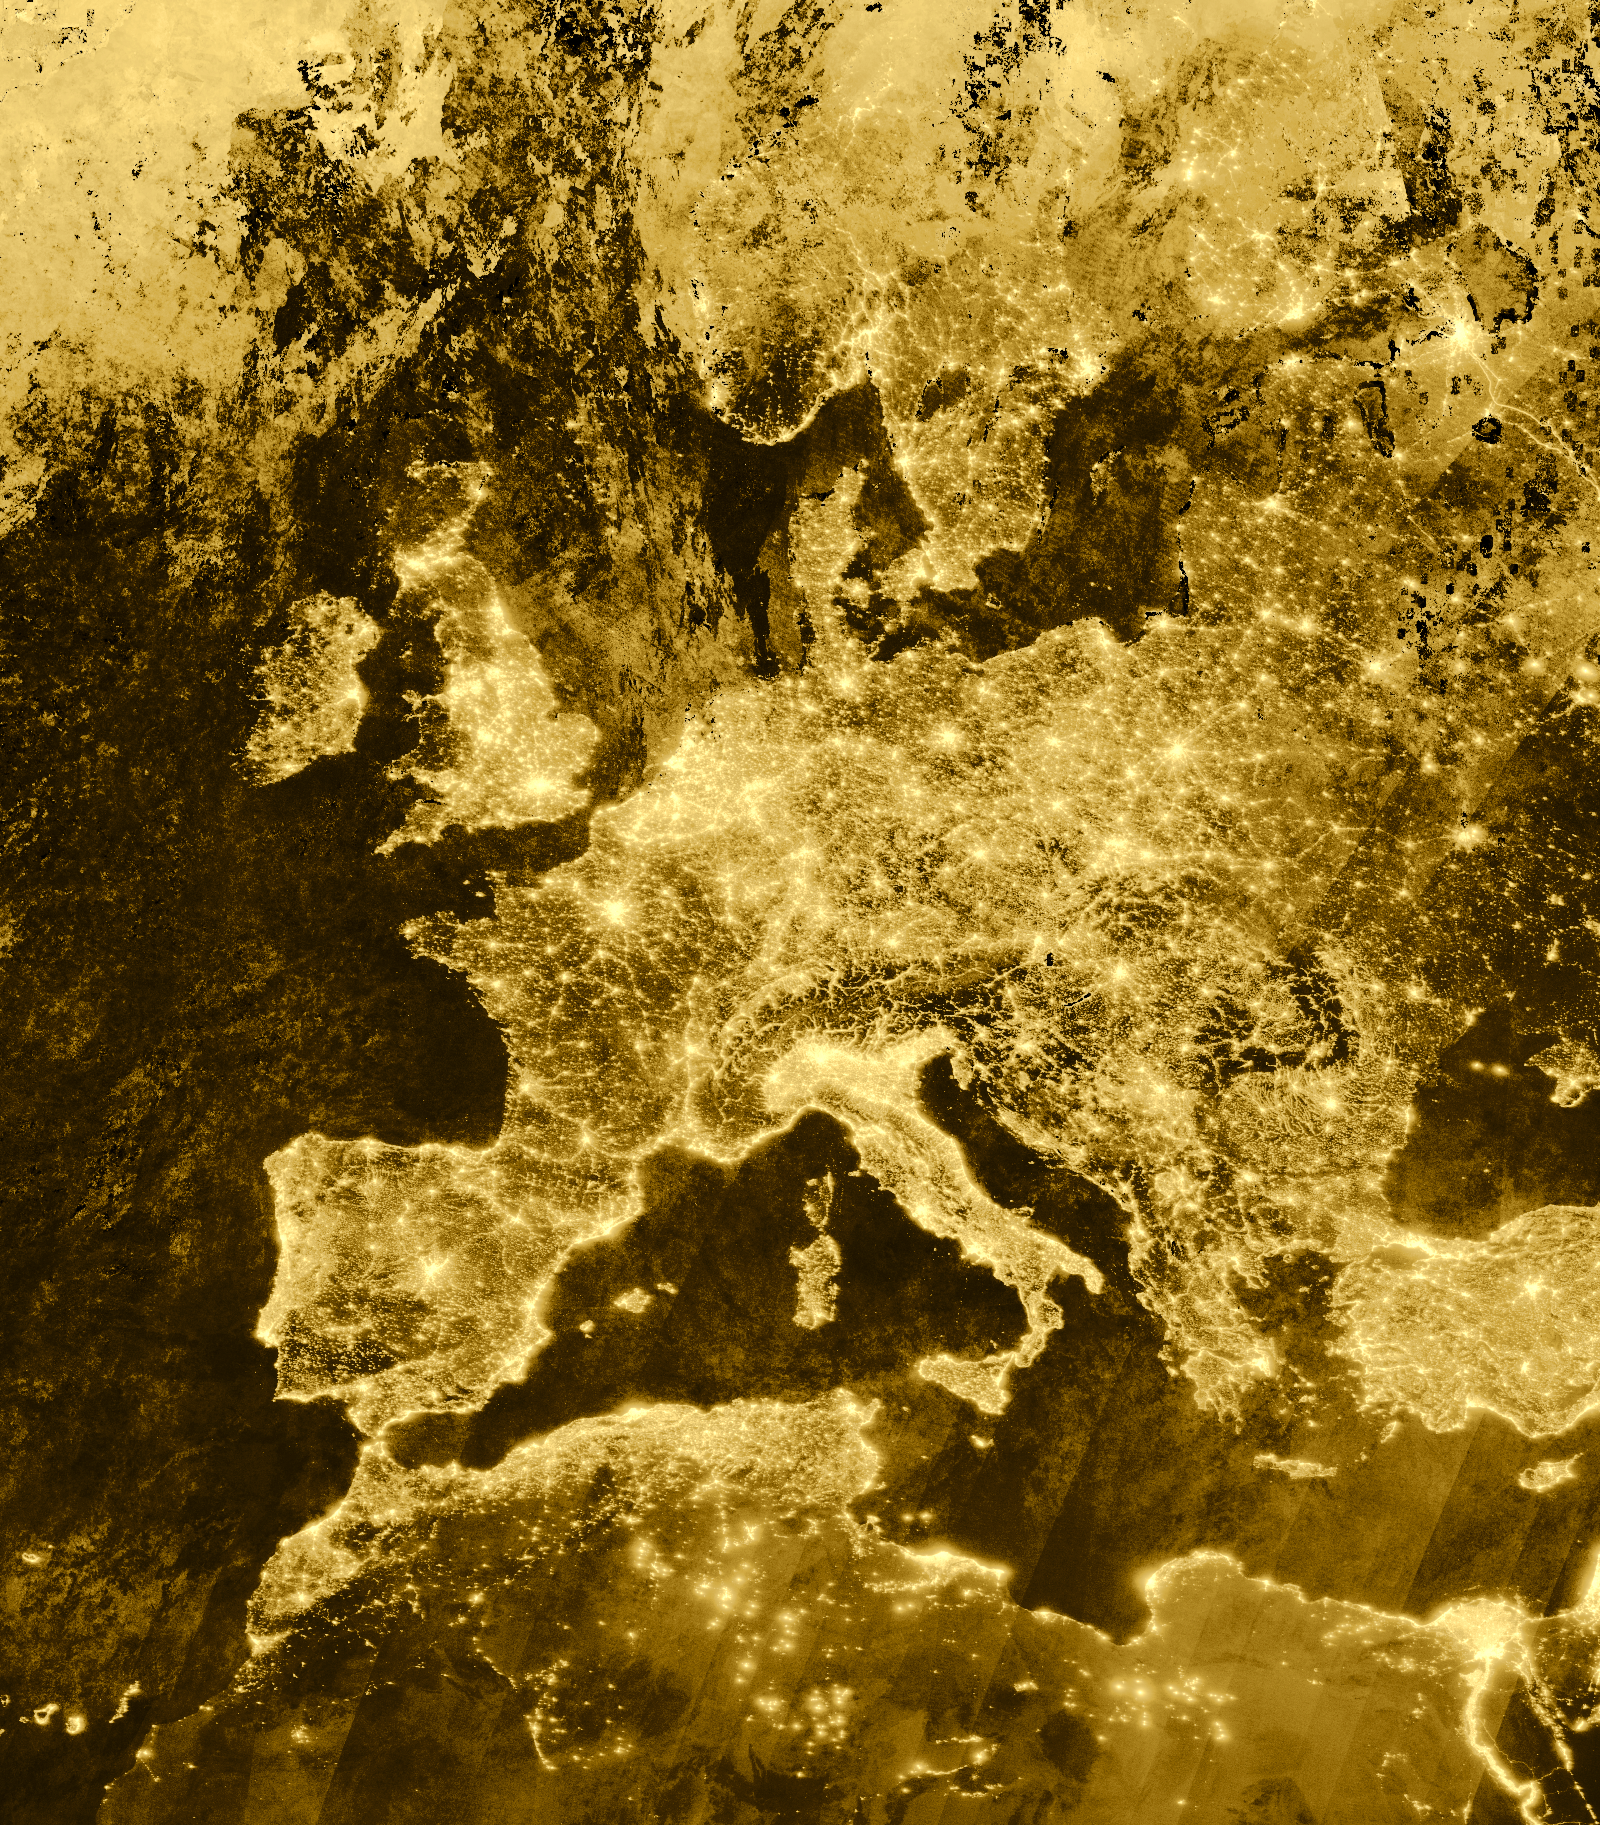
Raster, satellite & remote sensing. 15 years of cloud patterns over Southeast Asia, an end-to-end wildfire-damage pipeline on the 2025 LA fires (Sentinel + NASA FIRMS + OSM), Europe's nighttime lights in monochrome gold, and center-pivot irrigation detection from 23-band Wyvern imagery.
[VISUAL: Day 28 monochrome-gold nighttime lights, or Day 15 wildfire damage map.]
3D & surfaces. Edinburgh Castle from 50cm LiDAR, Lake Balaton bathymetry in 2D and 3D, a 3D population globe, the Moon's surface from NASA's lunar DEM, and England's deprivation as extruded H3 hexagons.
[VISUAL: Day 18 3D Moon surface or Day 16 Edinburgh Castle LiDAR terrain.]
Networks & graphs. The full Amazon basin reconstructed as a connected river graph, a witty "all Romes lead to Roads" routing map, and a flavor-similarity network of 300 ingredients.
[VISUAL: Day 22 glowing Amazon river graph.]
Creative, experimental & personal. A year of personal car trips as glowing route lines, physical string-art of Budapest planned in Python, ASCII-art population density, a 10-minute speed-map, and Italy's glowing coastlines.
[VISUAL: Day 9 string-art map or Day 4 personal travel paths.]
GeoAI preview. Building classification with Google AlphaEarth's 64-band data — a direct on-ramp to the full GeoAI course.
WHO THIS IS FOR
You want to actually learn the Python geospatial stack by building real things, not reading documentation. Thirty projects give you 30 reasons to use every core library.
You followed the #30DayMapChallenge on YouTube and want the source code, the data, and the behind-the-scenes reasoning that the free videos don't include.
You're a data scientist or analyst curious about maps and want a fast, broad, hands-on tour of what's possible.
You work with spatial data already and want a reference library of ready-to-adapt pipelines — isochrones, raster animation, 3D terrain, network routing — you can lift into your own work.
You learn by doing and like variety: a new dataset, a new technique, and a finished artifact every single project.
WHAT YOU'LL LEARN
By the end of this course you can:
Work fluently across the core Python geospatial stack — GeoPandas, Folium, Plotly, PyDeck, Rasterio, osmnx, Pandana, and more — and know when to reach for each.
Query and visualize OpenStreetMap data (POIs, roads, buildings) for any city.
Build accessibility and walkability analyses from GTFS and road networks, including isochrones and 15-minute-city measures you can run on any city.
Load, harmonize, and animate raster time-series — population, cloud cover, nighttime lights — into narrative time-lapses.
Build 3D terrain and surface models from LiDAR, bathymetry, and DEMs, and extruded 3D hex maps with PyDeck.
Run a real end-to-end satellite analysis pipeline: acquire imagery, process bands, and detect features (wildfire damage, irrigation circles).
Think in graphs for spatial problems — river basins, routing, similarity networks.
Reproduce a professional map aesthetic: glow effects, custom palettes, projections, and clean cartographic styling.
Take a first concrete step into GeoAI with a multispectral building-classification model.
COURSE STRUCTURE
1. Getting Started — Orientation, the behind-the-scenes of planning 30 maps in 30 days, and a setup walkthrough that gets all the notebooks running out of the box (use the conda command in Setup.ipynb to pin the right numpy version across every library).
2. Vector Foundations — Five projects on POIs, road networks, habitat polygons, landmark cutouts, and projection.
3. Urban Analytics & Accessibility — Four cities, isochrones, urban form, and walkability from GTFS and OSM.
4. Time, Change & Animation — Manhattan's growth, Dubai's expansion, and a projection to 2125.
5. Raster, Satellite & Remote Sensing — Cloud patterns, wildfire detection, nighttime lights, and multispectral irrigation mapping.
6. 3D & Surfaces — LiDAR, bathymetry, DEMs, and extruded hex maps — a zoom-out arc from a castle to the Moon.
7. Networks & Graphs — River basins, routing, and similarity networks.
8. Creative, Experimental & Personal — String art, ASCII maps, personal mobility, speed-mapping, and neon coastlines.
9. GeoAI Preview — Building classification with Google AlphaEarth, leading into the full GeoAI course.
10. Tools & Data — A permanent reference: every dataset used, where to get it, and a structured tour of the full Python geospatial stack.
WHAT'S INCLUDED
🎬 ~8 hours of video across 40 lessons on the New Science of Maps platform
📓 30 executed, self-contained project notebooks (Days 1–30)
🗂️ Ready-to-run data samples for every project
🧰 A permanent Tools & Data reference section
♾️ Lifetime access, including future updates
PREREQUISITES / WHO IT'S NOT FOR
Prerequisites: basic Python comfort and willingness to run notebooks. No prior geospatial or GIS experience needed — the sections build the stack as you go.
Recommended companions: as a broad tour, this pairs well with the deeper tracks — Urban Analytics with Python: An Introduction for cities, Fundamentals of GeoAI for deep learning, and the book Geospatial Data Science Essentials: 101 Practical Python Tips and Tricks as an all-round reference.
Not for you if: you've never written any code, or you want a single deep theoretical treatment of one method.
INSTRUCTOR
Taught by Milan Janosov — geospatial data scientist, network scientist (PhD), and the person behind the 2025 #30DayMapChallenge. You build alongside a working scientist, with the real reasoning and the honest behind-the-scenes included.