Network Science & Visualization:
From Foundations to Practice
Build and visualize real networks from scratch — on real data.
Almost everything worth understanding is a network: cities and their roads, collaborators and their papers, characters and their alliances, software and its dependencies. Network science is the framework for reading those connections — and this course gives you the practical foundation to work with networks confidently, from the first node to a finished, publication-quality visualization.
WHAT THIS IS
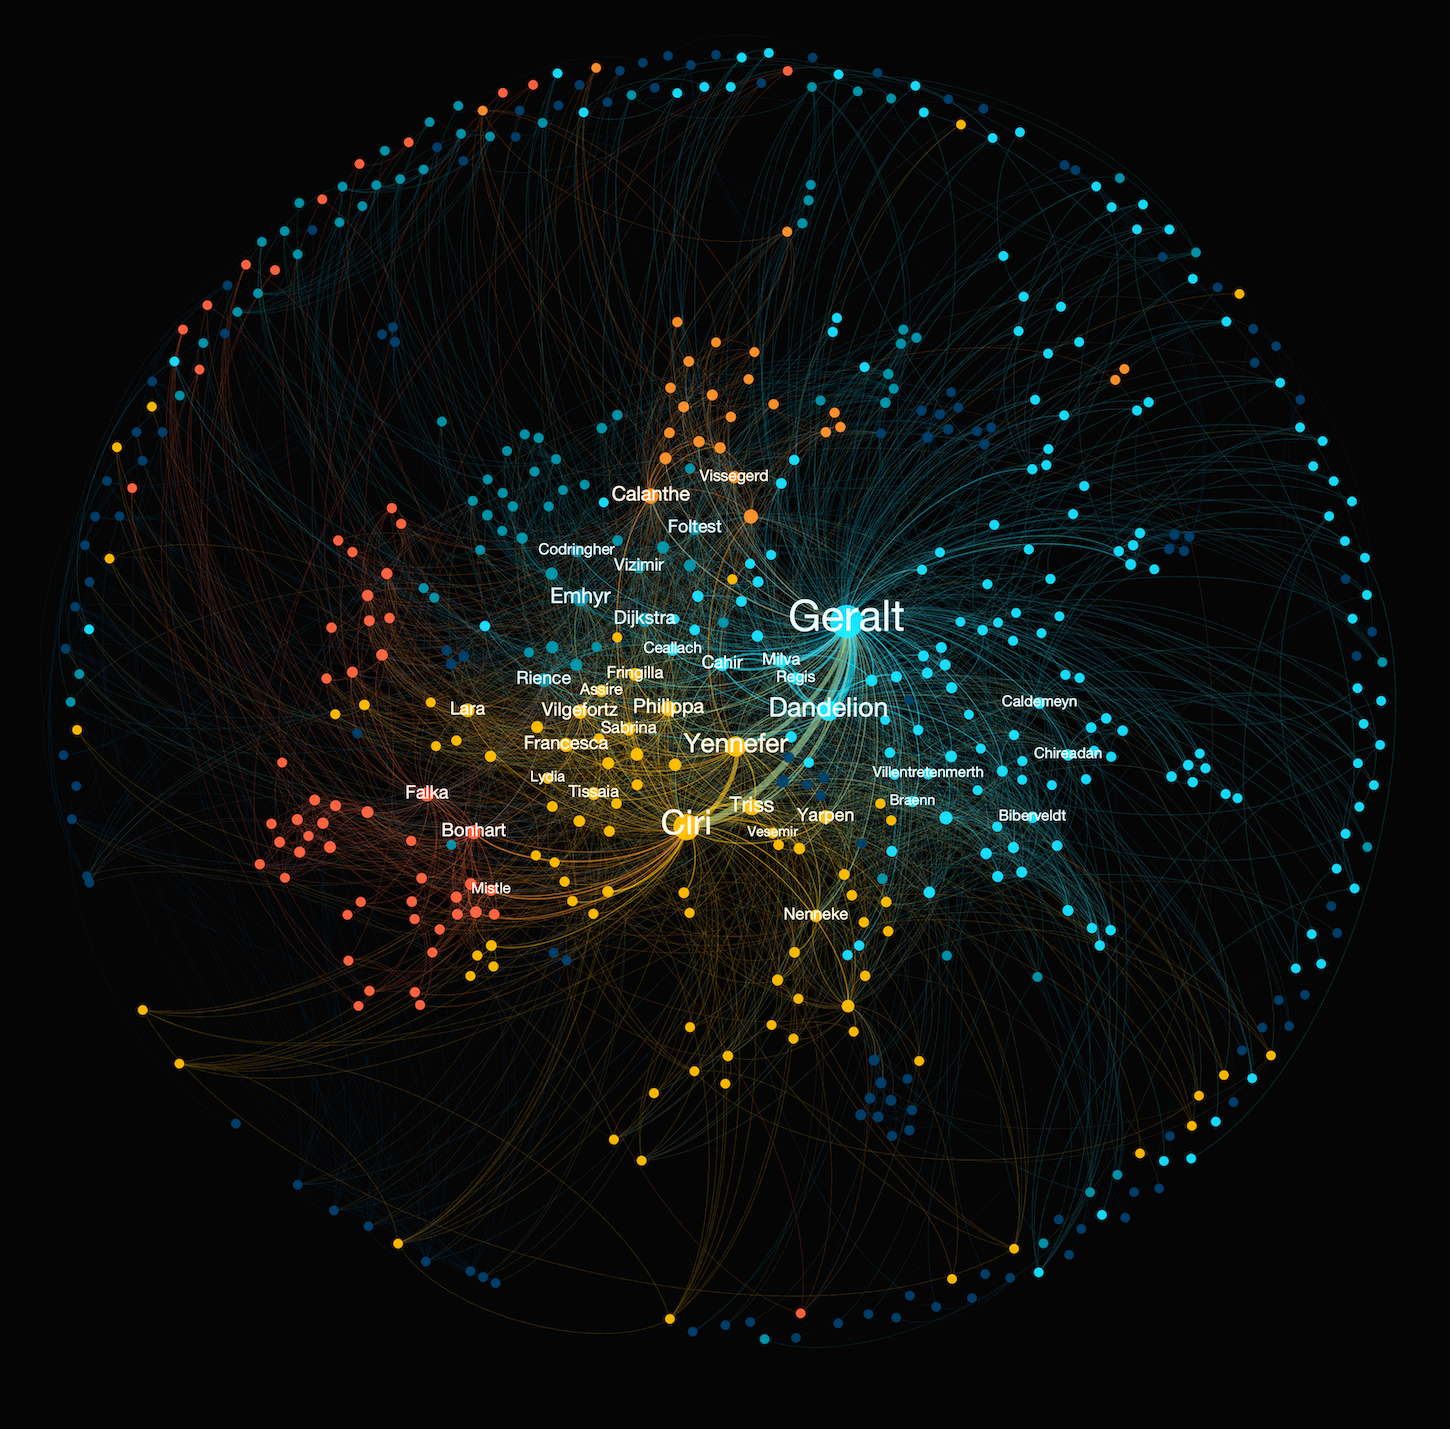
A hands-on, build-alongside introduction to network science. Rather than starting with theory, you build understanding from the first node up — concepts, then centralities, then a full Gephi visualization workflow — on real networks that are genuinely fun to work with, like the Witcher character network. Every concept is shown on real data, so you don't just learn definitions; you see structure emerge.
WHAT YOU'LL BUILD
Four modules that take you from concepts to finished visualizations.
Foundations. Understand what networks actually are: nodes, links, paths, and network diameter — and see the concepts through real examples of networks drawn from very different domains.
Centrality & structure. Measure what matters in a network: node degree, PageRank, clustering, and community detection — the tools that tell you who's important, what's central, and how a network breaks into groups. Includes a hands-on centralities exercise.
Visualization in Gephi. Turn a raw network into a clear, beautiful figure: layouts, coloring, sizing, and export — taught around the Witcher character network so you learn the workflow on data that's genuinely fun to work with.
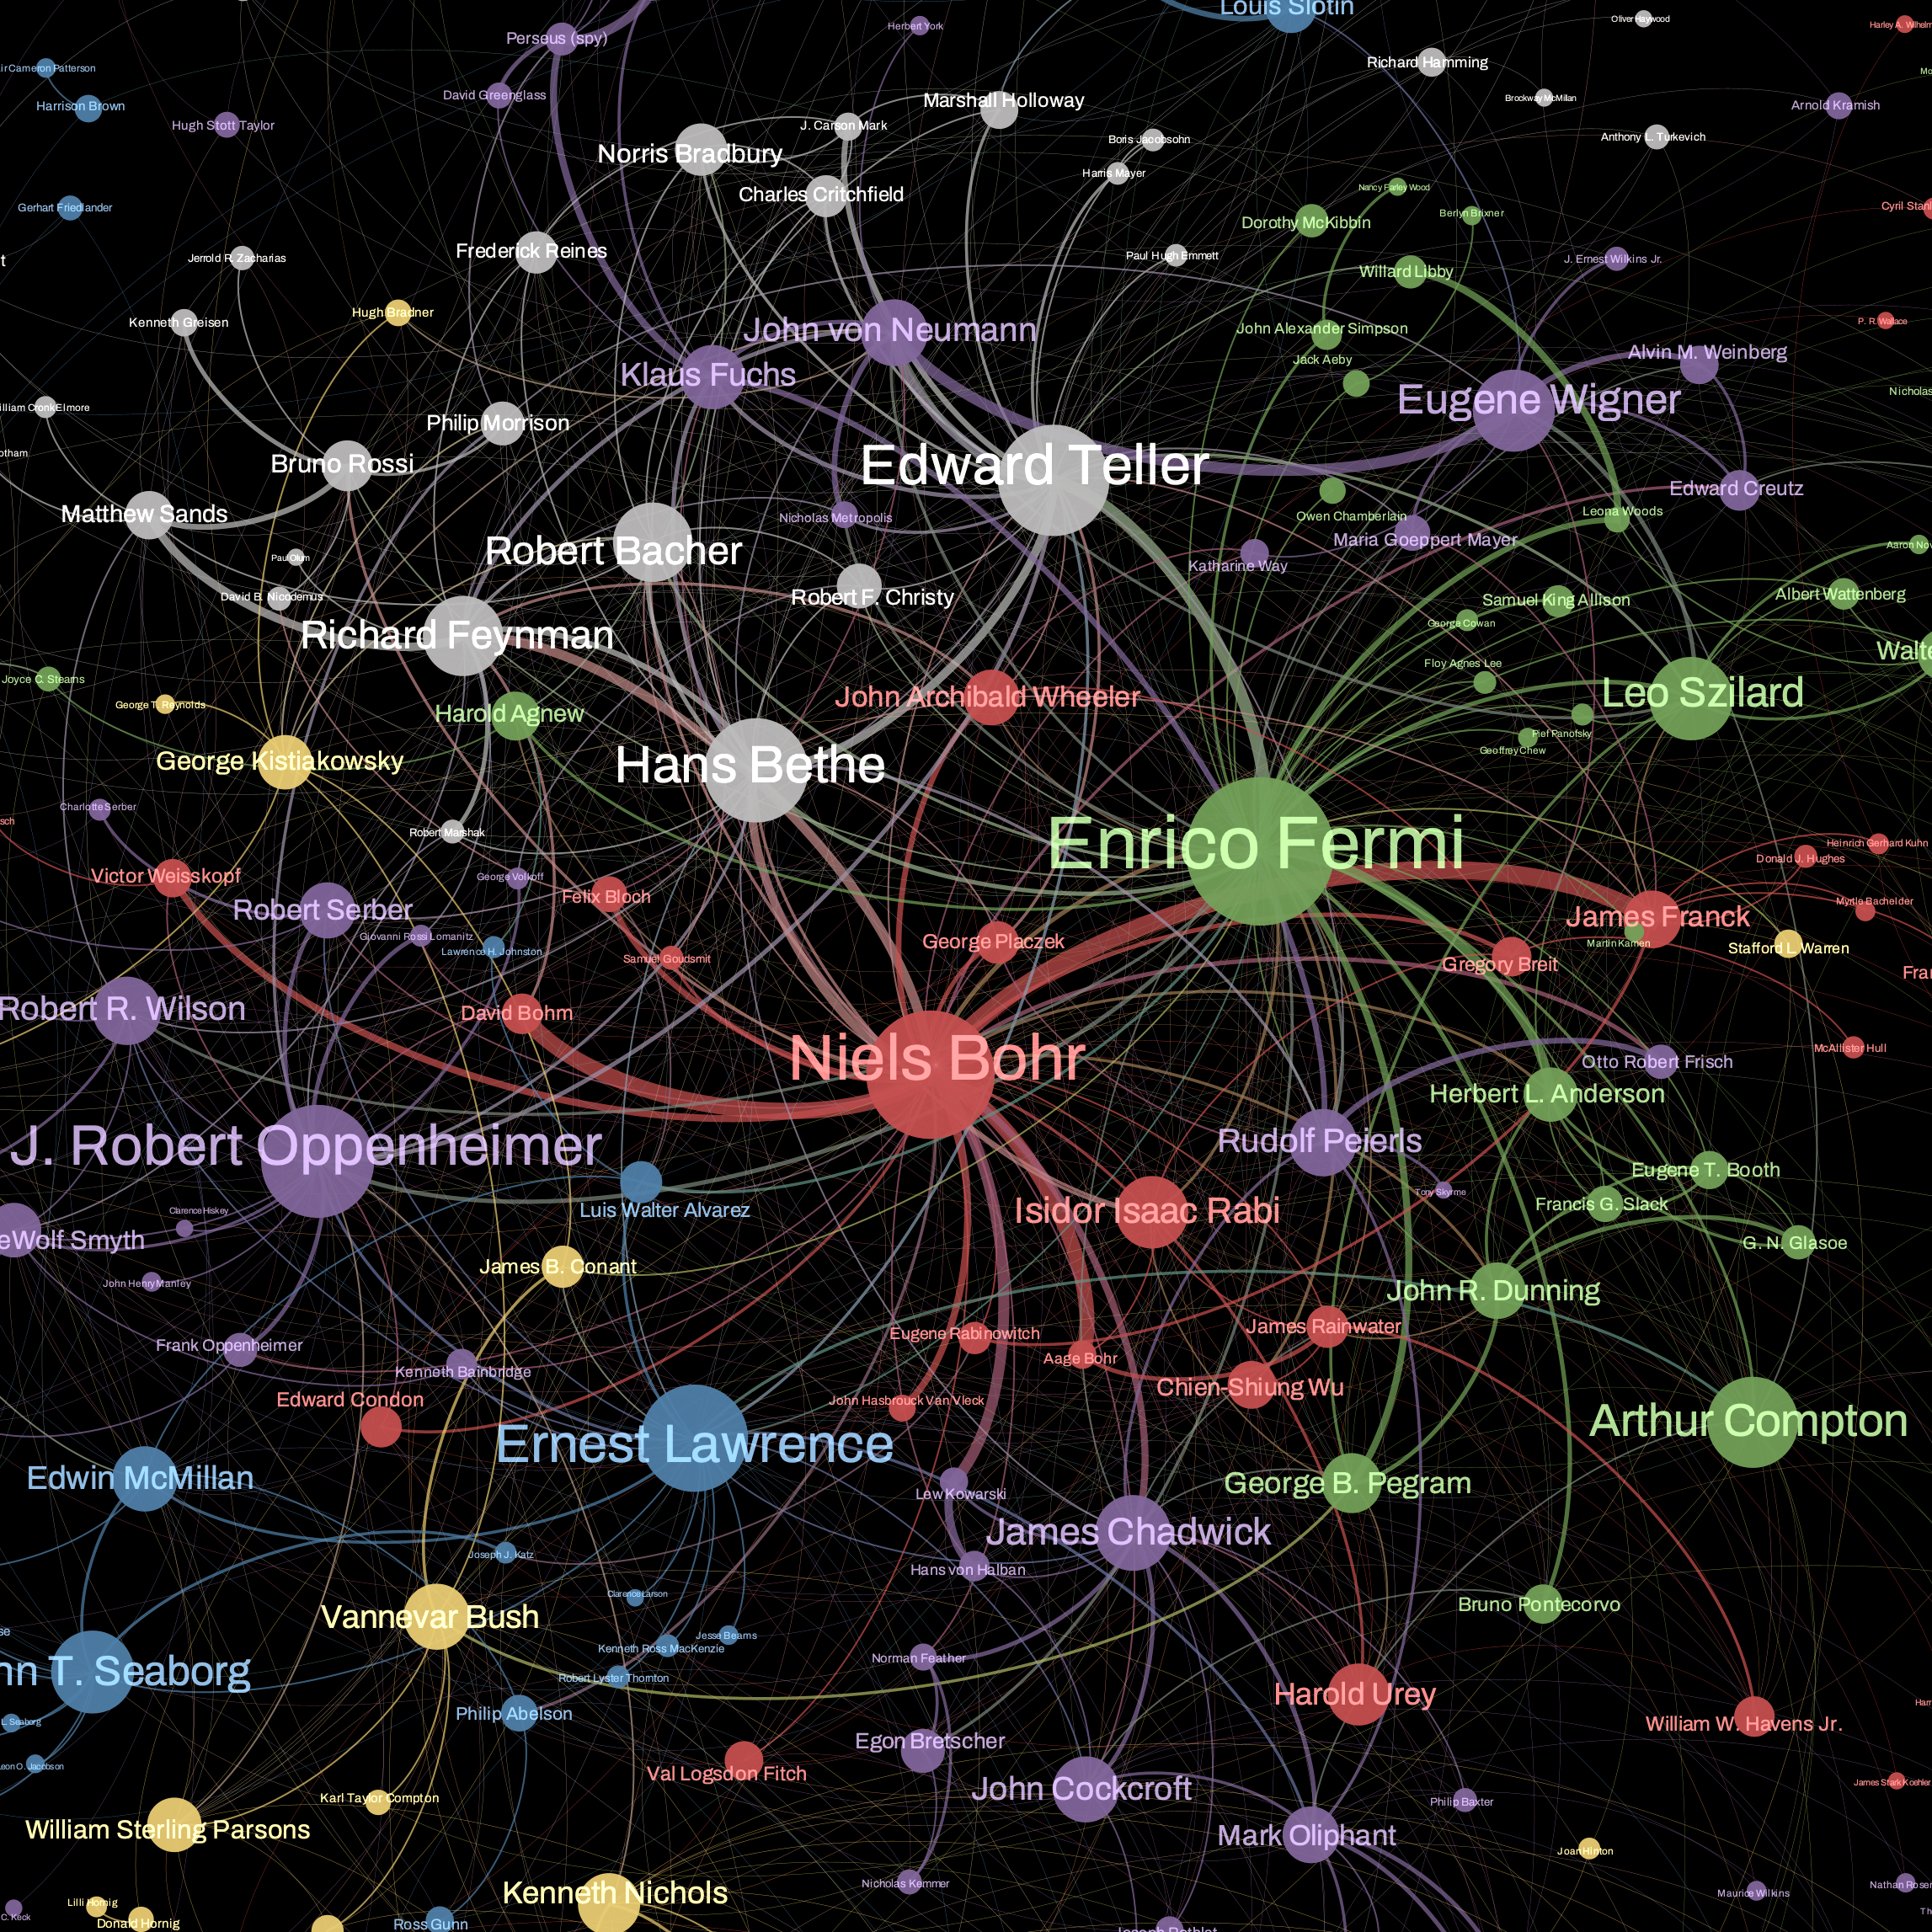
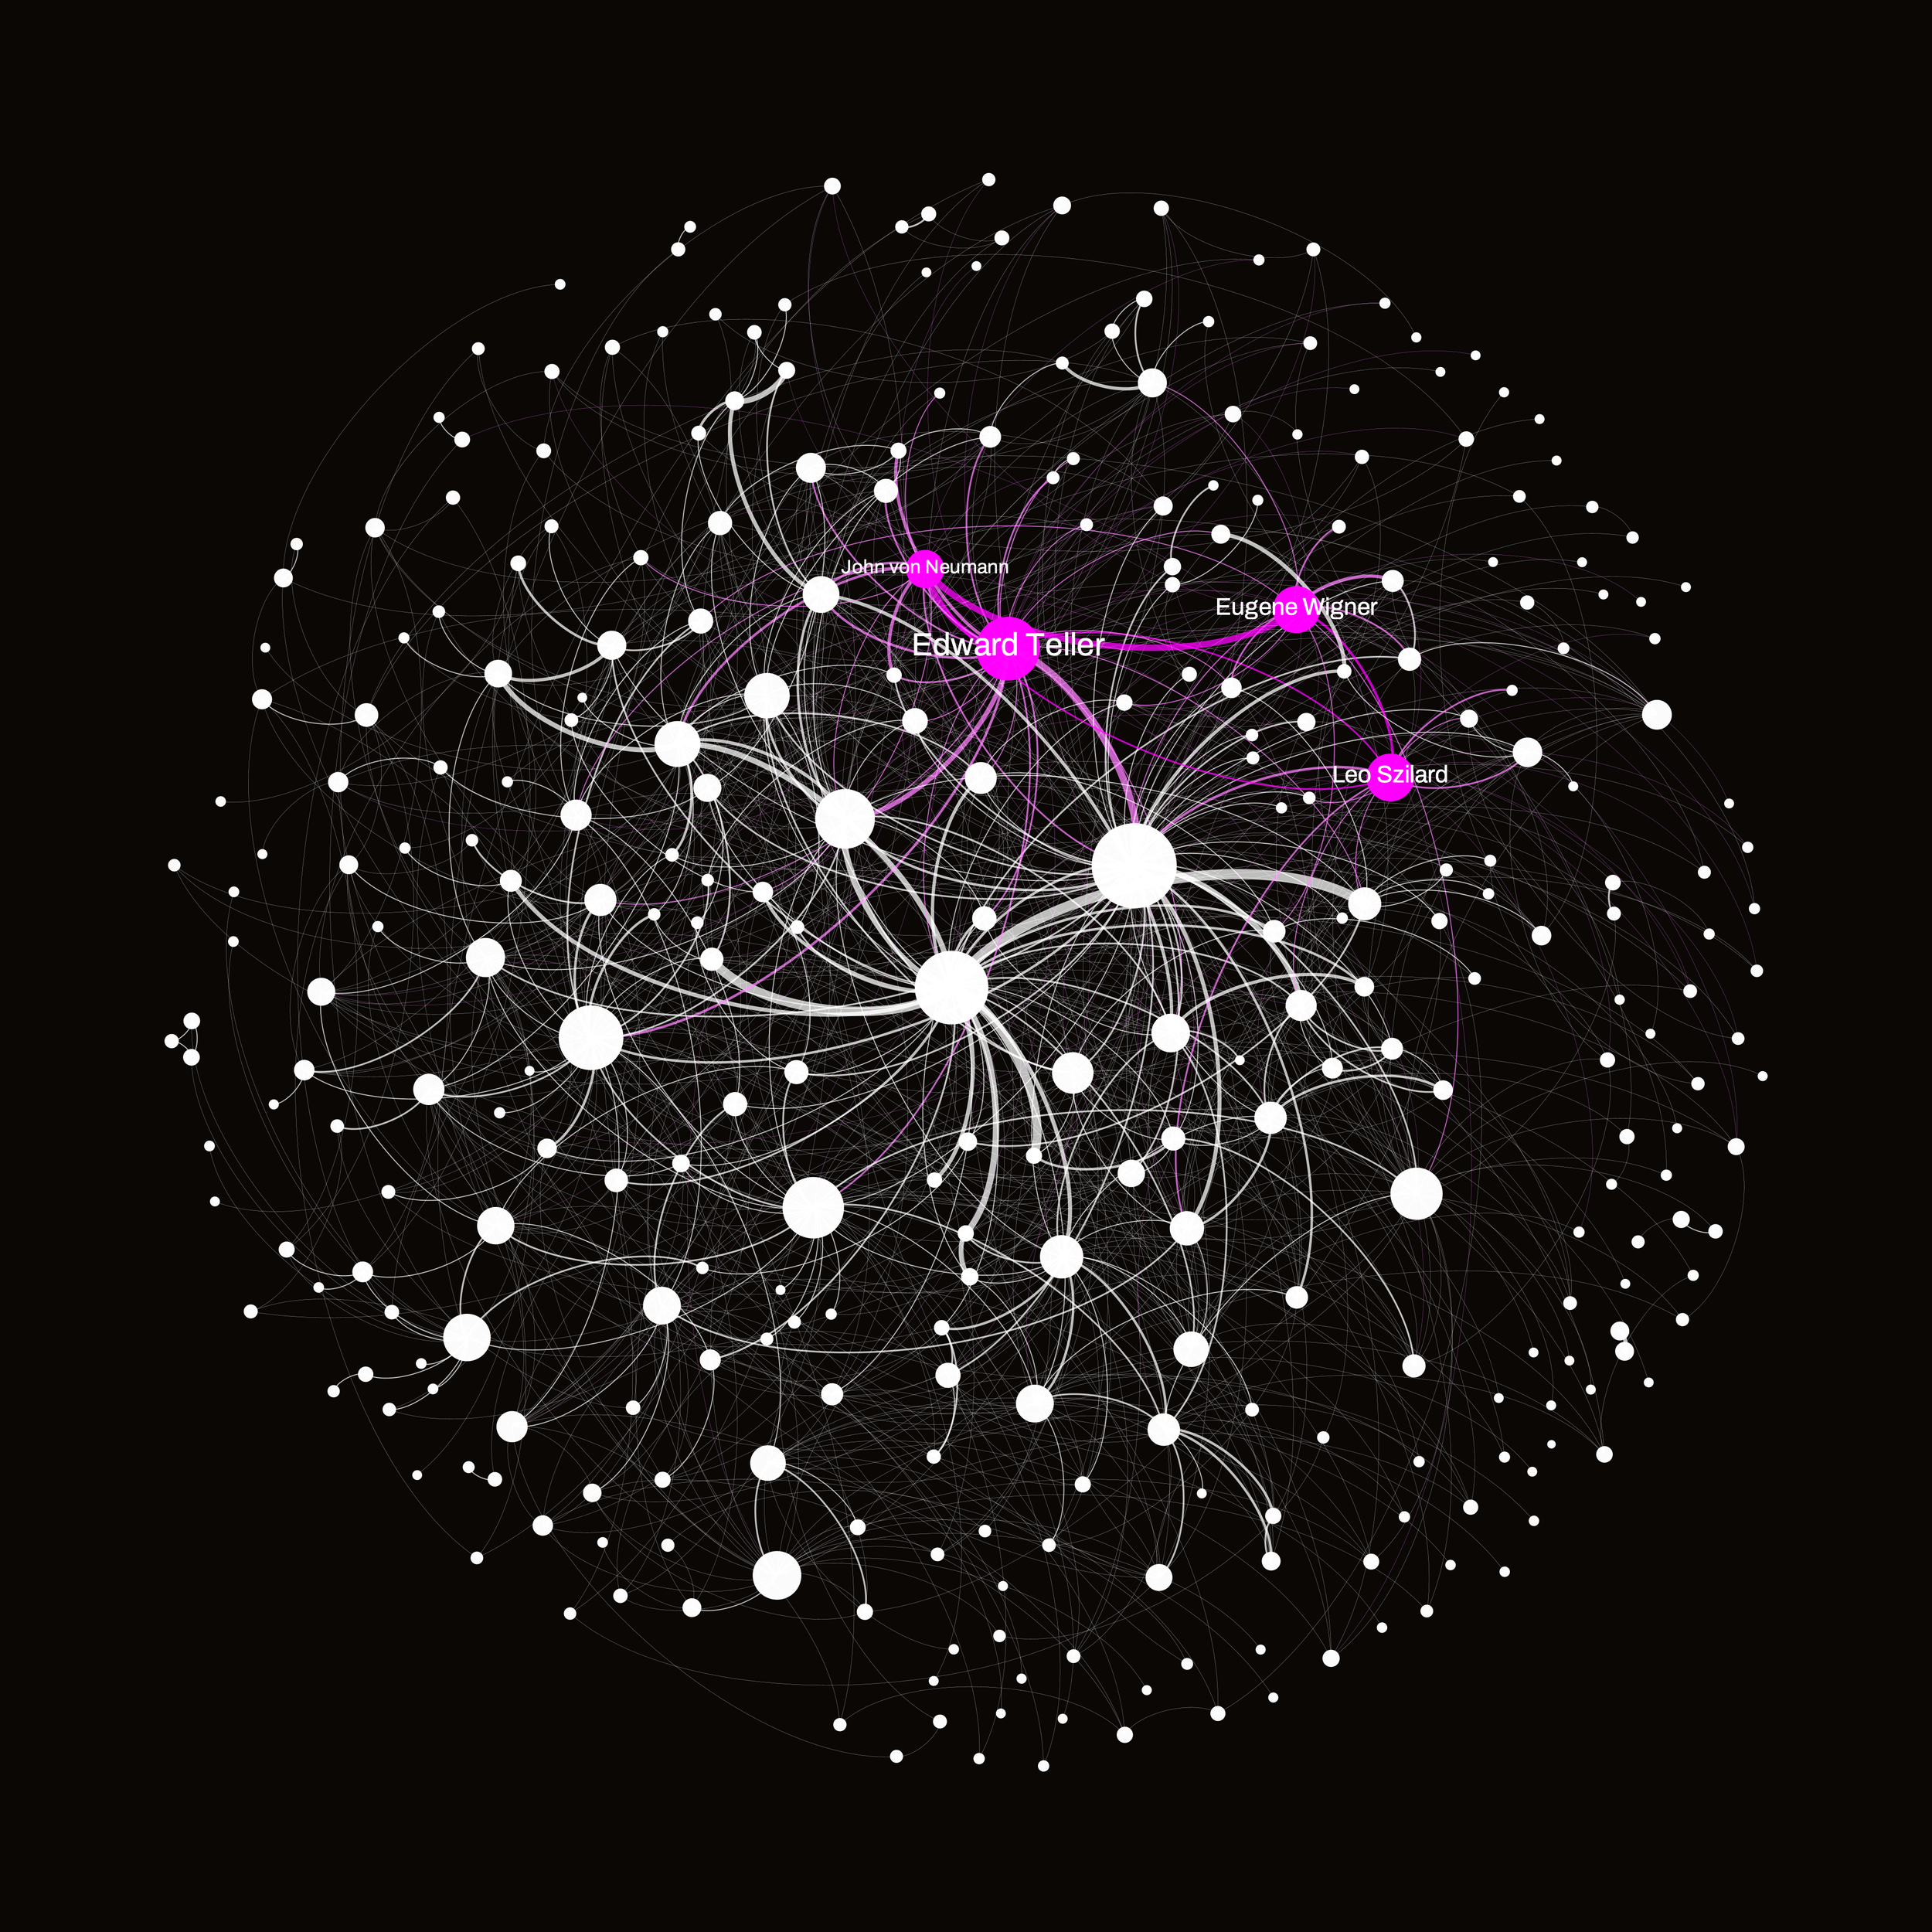
Visualization walkthroughs. Apply the workflow to three more real networks: the Manhattan Project collaboration graph, a Nobel-laureate network, and a live Python library network.
WHO THIS IS FOR
You work in data science or research and want to add network analysis — one of the most versatile analytical frameworks there is — to your toolkit.
You work in urban analytics or the social sciences and keep running into problems that are really about connections: mobility, collaboration, influence.
You need to communicate complex relationships visually and want to produce clear, publication-quality network figures rather than tangled hairballs.
You're curious about complex systems and want a concrete, hands-on way in — starting from zero.
WHAT YOU'LL LEARN
By the end of this course you can:
Explain the core building blocks of any network — nodes, links, paths, and diameter — and recognize network structure in real-world systems.
Compute and interpret the key centrality measures — degree, PageRank, and clustering — to identify hubs, bridges, and influential nodes.
Detect communities and understand how a network partitions into meaningful groups.
Build a clean, readable network visualization in Gephi from raw data: layout, color, size, and export.
Apply that same workflow confidently to new datasets of your own.
COURSE STRUCTURE
Module 1 — Foundations
What network science is, and a tour of real networks across domains. Nodes, links, paths, and diameter, built from first principles.
Module 2 — Centralities & Community Detection
The anatomy of networks and the core centrality measures — degree, PageRank, clustering — plus community detection, with a hands-on exercise.
Module 3 — Network Visualization in Gephi
A visualization overview, a warm-up on a dummy network, then the full Gephi workflow — layouts, coloring, sizing, export — built around the Witcher network.
Module 4 — Visualization Walkthroughs
Three applied builds: the Manhattan Project collaboration network, Nobel laureates, and a live Python library network.
WHAT'S INCLUDED
🎬 ~2.5 hours of video lectures on the New Science of Maps platform
📁 Gephi project files and datasets for every module
🐍 The Witcher network and other ready-to-use datasets
♾️ Lifetime access, including future updates
PREREQUISITES / WHO IT'S NOT FOR
Prerequisites: curiosity about connected systems and willingness to follow along in Gephi. No prior network science, math, or heavy coding required — Module 1 starts from the very beginning.
Recommended companions: prefer to build networks in Python from scratch rather than in Gephi? Network Analytics in Pythonis the code-first counterpart — the two are available together as a bundle. For more network and stories, check Connecting the Dots.
Not for you if: you want an advanced, math-heavy graph-theory course, or a code-first path (see the counterpart above).
INSTRUCTOR
Taught by Milan Janosov — network scientist and geospatial data scientist (PhD). You build alongside a working scientist, on real data, with the practical judgment that turns a raw graph into something worth looking at.