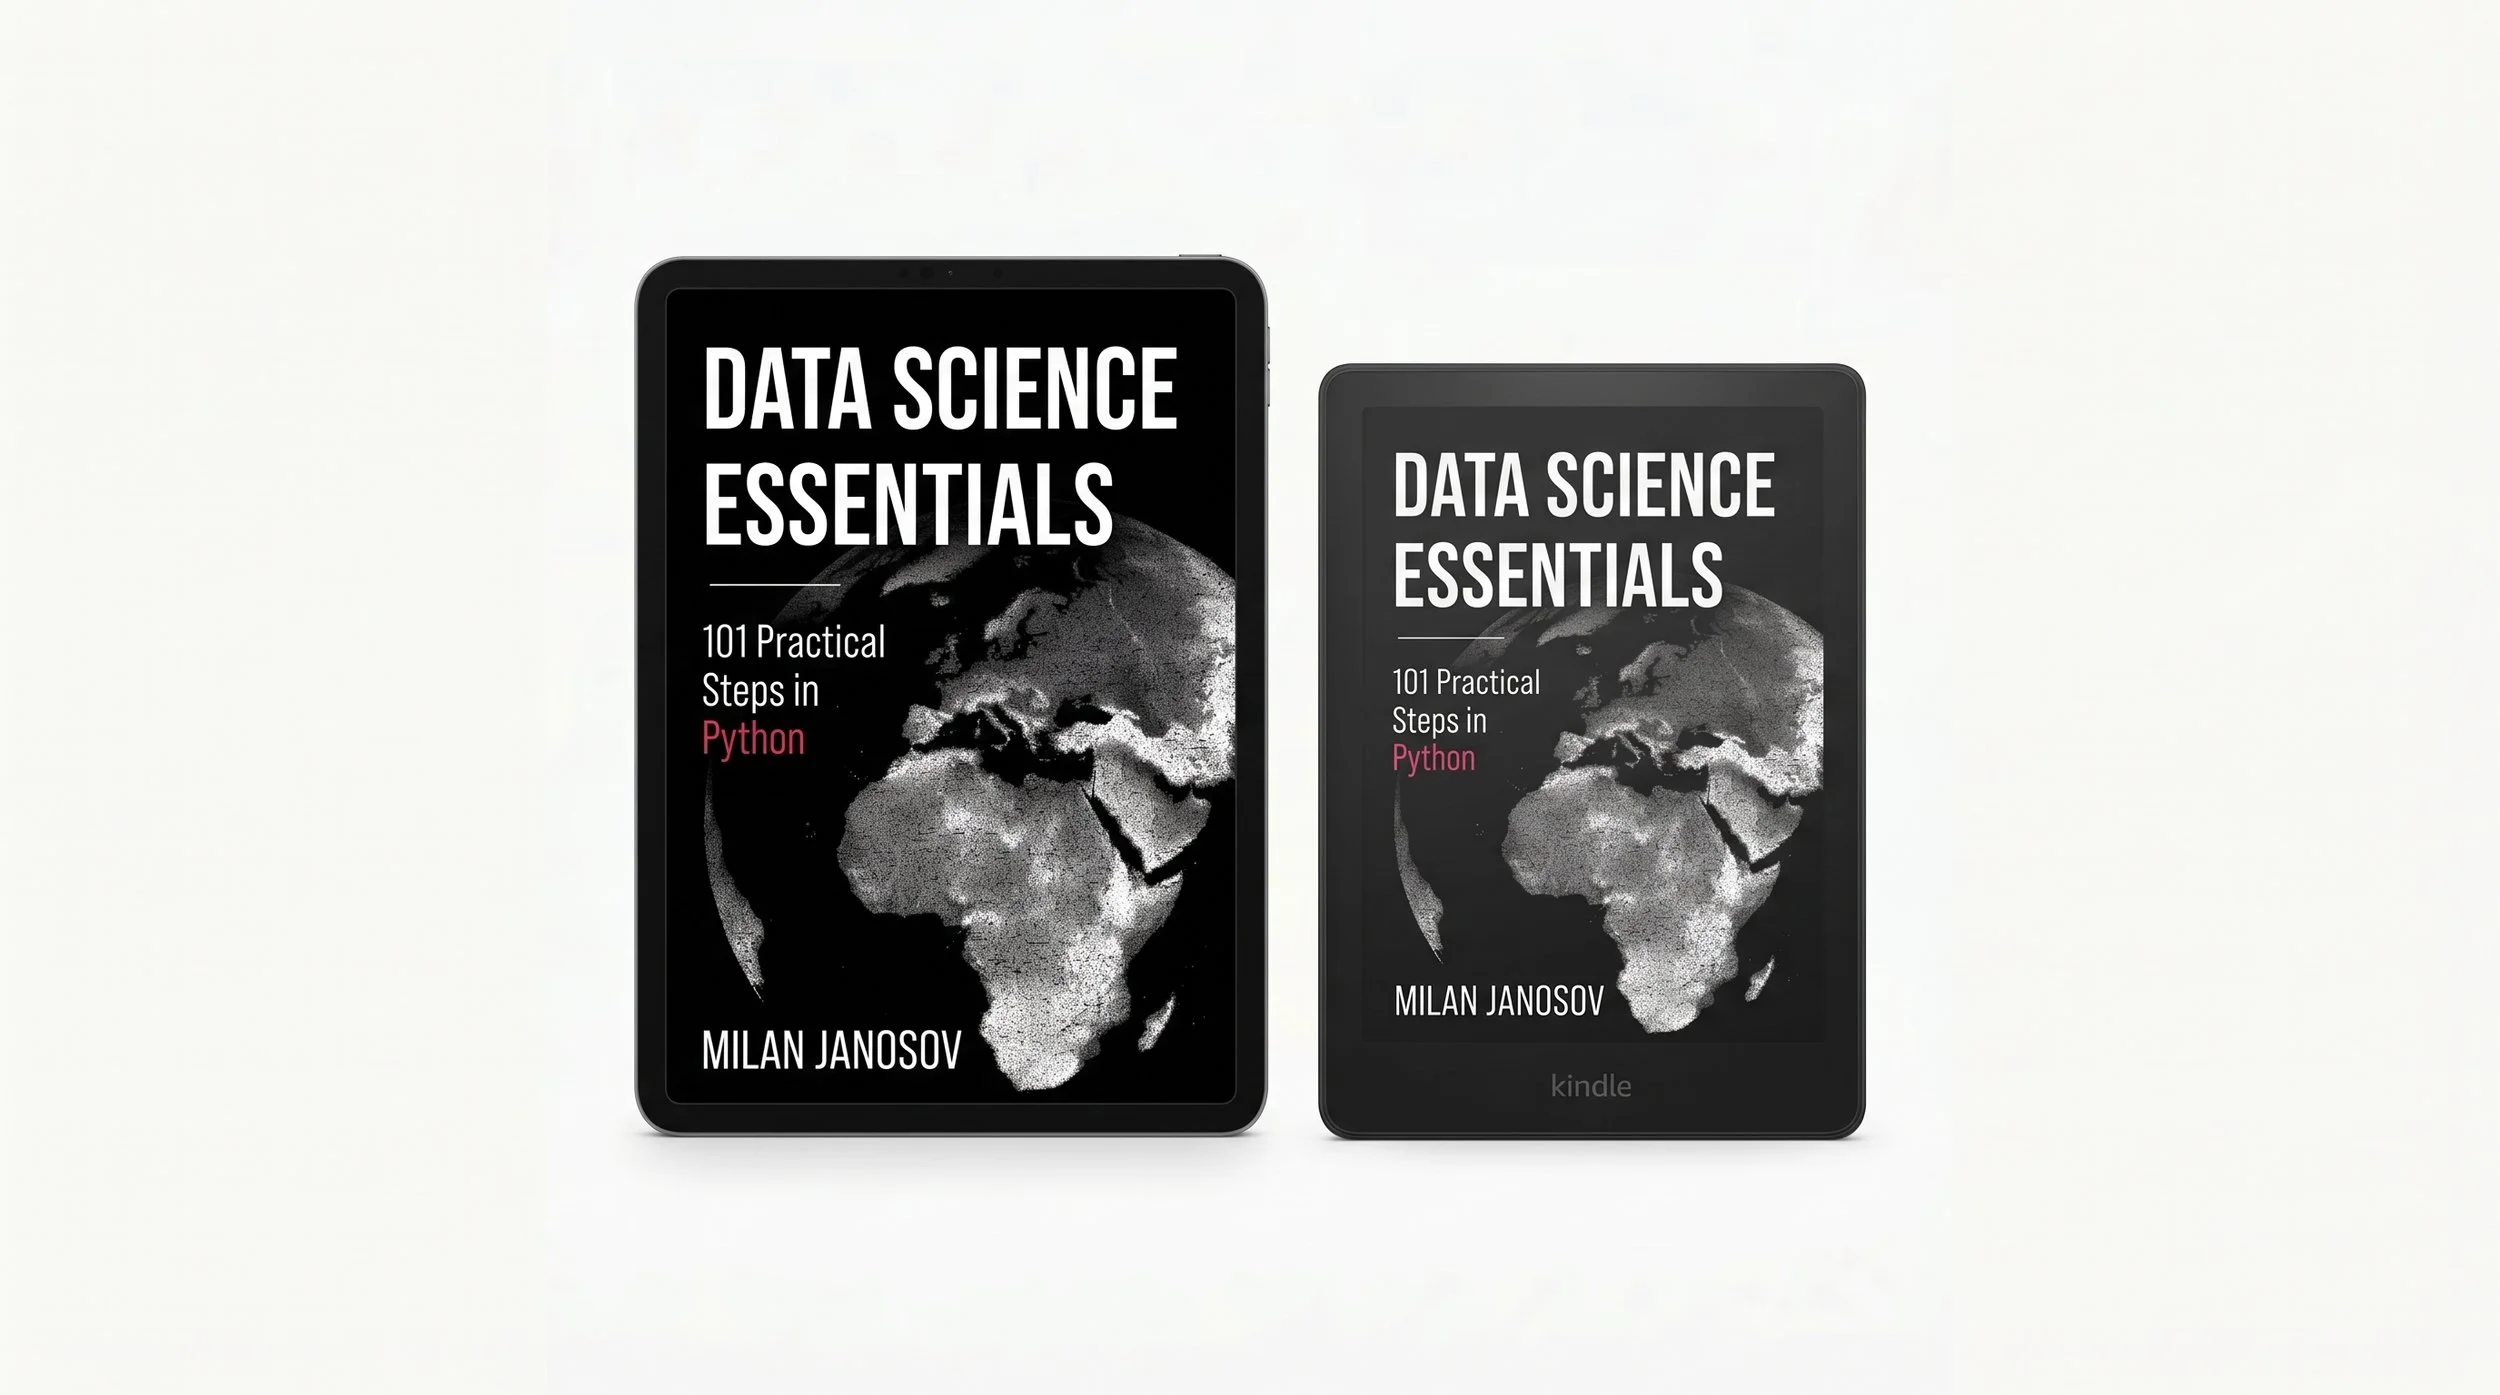
Our work speaks for itself.Data Science Essentials:
101 Practical Steps in Python
What is this
The ground floor. Where the Geospatial Data Science Essentials series assumes you already work with data and want the spatial stack, this one starts from an empty computer and gets you to a number you can defend.
101 numbered steps across 12 chapters. 246 pages. 2,087 lines of code, printed in full. 30 generated charts and 6 explainer diagrams. Every step opens on a concrete problem, hands you code you run yourself, and closes with one line worth remembering.
The through-line is judgment, not syntax. Almost everything that goes wrong in real data work goes wrong quietly: a column of dollar amounts that is secretly text, an average dragged down by three countries recorded as having no people, a bar chart whose baseline was moved, a model whose impressive score was measured on the rows it had already seen. None of these raise an error. All of them change a decision. This book teaches the tools by teaching you to catch them.
The whole book is free as a PDF. Not a sample — the complete 246 pages.
What's included
Free PDF: the full book, 246 pages, pay what you want including nothing.
Full Bundle: the same PDF · 12 Jupyter notebooks, one per chapter · countries.csv, the deliberately broken 244-row dataset · countries_clean.csv, the 238-row file Chapter 7 produces · Natural Earth admin-0 boundaries · environment.yml with every version pinned, so your machine runs exactly what mine did.
Full outline
Chapter 1 — Getting Started · Install Python the easy way · Cells, the kernel, and the order that counts · Comments · Markdown cells · Installing your first library · Reading an error message · Your workspace
Chapter 2 — Values, Variables, and Talking to Python · Your first variable · Numbers and arithmetic · Strings · Making the notebook talk back with print() · f-strings, format specs, and converting between types · Booleans and comparisons · Reassignment and updating values · Deliberate errors, done properly
Chapter 3 — Core Data Structures · Creating a list · List functions: len(), min(), max(), sum() · Indexing, forwards and backwards · Slicing · Strings are sequences too · Growing a list with append() · Sorting a list · Tuples and unpacking · A dict as one record: create, read, update · From one record to many: keys(), values(), items() · Sets: unique values only
Chapter 4 — Flow and Functions · The for loop · Counting with range() · Looping over pairs: .items(), enumerate(), zip() · Making decisions with if / else · Combining conditions with and / or / not · Membership with in · The accumulate pattern · List and dict comprehensions, with and without a filter · Writing your first function with def · Writing a one-line function with lambda · Putting it all together: from raw lists to ranked records
Chapter 5 — NumPy Basics · Your first arrays: one dimension · One dimension up: grids · Painting the house scene · Aggregations: collapsing the grid to a few numbers · Vectorized arithmetic: an array and a number · One array against another: a vegetation index · The boolean mask: select by condition · Aggregating and counting what matched · Changing what matched
Chapter 6 — pandas I: Meeting Your Data · Building a DataFrame by hand · Loading the country dataset with read_csv · The first-look ritual: head(), len(), .columns, .info() · Selecting a column · Deriving and updating a column · Filtering a DataFrame: one condition, several, and isin() · Finding specific rows: sort, then loc / iloc · The one-line overview with describe()
Chapter 7 — pandas II: Cleaning and Combining · Rescuing GDP from text: diagnose, repair, convert · Missing values: dropna() vs fillna(), four ways to fill · Impossible numbers: negative areas, zero areas, final dtypes · String repairs: trimming the key, peeling a prefix · Fixing the continents: a rule, a validation, a mapping table · Duplicates: find them, then drop them · Joining a second table with merge() · Grouping with groupby(): split, apply, combine, then sort · Column hygiene with drop() and rename() · Saving the cleaned table with to_csv()
Chapter 8 — Visualization with matplotlib · The figure–axes pattern · Your first plot: titles and axis labels · Styling: colour, alpha, size, edges · Line or points? · The histogram: the default distribution check · Bar charts: population by continent · Finalizing scatter plots · Legends and multi-series plots · Misleading visuals
Chapter 9 — Statistics in Python · Mean vs median · Distributions: same center, different worlds · Scaling and standardization · Sampling variation · Uncertainty you can see · Correlation with .corr() · Correlation ≠ causation · Comparing two groups · How big is the difference?
Chapter 10 — The Basics of Machine Learning · What a model is: the lay of the land · Fitting your first model: a line through the data · Predicting, and how wrong we are · The train/test split, and k-fold · Chaining preprocessing and model with make_pipeline() · Classification with LogisticRegression · Evaluation metrics that matter · K-means clustering · When NOT to use ML
Chapter 11 — Coding with an AI Assistant · Asking an assistant: the vague prompt · Writing a precise prompt: context, goal, constraints · Setting up: the key, the library, the client · The first API call: messages in, text out · Looping the model: facts against the table, answers across models · Checking replies against your own rule
Chapter 12 — Where Data Meets the Map · Latitude, longitude, and your first map · Sizing and coloring points by data · A taste of GeoPandas · K-means clusters on a map
Who is this for
You, if you are good at your job and have arrived at the point where you need to trust a number yourself instead of waiting for someone else to produce it. You, if you have started Python and want data science deeper than a tutorial, without a career change attached. You, if you want to be the person in the room who can check the number.
Not for you if you want a machine-learning engineering job — there is no deployment, no MLOps, no model zoo. Not for you if you want a theory-first treatment of statistics, or a reference manual for every function in pandas. Those books exist and do those jobs well.
Prerequisites: you can read a spreadsheet, and you are willing to type the code rather than watch it. That is the whole list. No prior programming, statistics, or machine learning assumed — Chapter 1 starts with installing Python.
What you build
A working environment from one environment.yml — Python 3.12, pandas 3.0, NumPy 2.3.5, matplotlib, scikit-learn, scipy, geopandas, every version pinned
A deliberately broken 244-row country table, repaired into a 238-row file you proved clean — with every dropped row counted out loud
Six families of planted defects caught by hand: text posing as numbers, sentinel values, impossible zeros, negative areas, duplicates, untrimmed join keys
A toy satellite scene in NumPy, and an NDVI-style vegetation index computed with no loop
Every chart type drawn twice — the honest version beside the misleading one, until the axis crimes become visible
A permutation test run by shuffling labels yourself, then confirmed by scipy in one line
A bootstrap confidence interval, so a mean arrives as a range instead of a false certainty
A confounded correlation of 0.58 collapsing to −0.07 once you divide the third variable out
A linear regression, a logistic classifier, a confusion matrix, and k-means clusters — each scored on data the model never saw
A one-line rule that beats your trained classifier 95.3% to 82.2% on the same five folds — and the judgment to know when that means skip the model
An AI assistant put to work, then checked against a rule you wrote first
A clustered world map, from two float columns that had been sitting in the table since Chapter 6